Background of Population
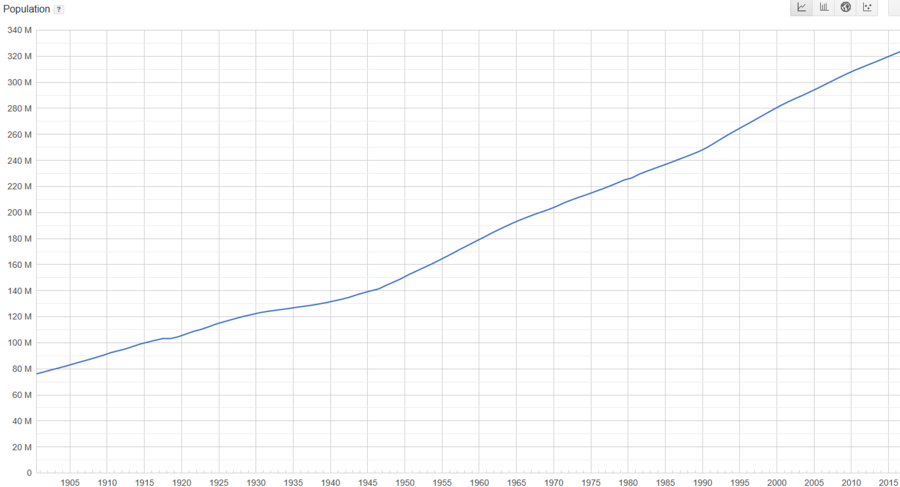
In order to have a better sense of how the US population has grown, here is a graph of the population in the United States based on the official data from the government website: https://www.census.gov.
The above image shows the trend of the US population (U.S. Population, 2018). The x-axis indicates the year, and the y-axis shows the size of the population in the United States. It is easy to observe the change in the size of the population in the United States. For instance, between 1915 and 1920, the population does not increase smoothly.
The size of US population is determined by birth rate, death rate, net migration, and other economic and other sociological factors, such as government policy, technology, age, sex distribution, and economic growth.
The population projection is based on the mathematical models such as exponential models and logistic models. Since each model only considers limited factors determining the size of the population, it has its own disadvantages. For instance, when people use the logistic model to predict the future population size, the model only considers birth rate, death rate, initial population size, and the carrying capacity of that region. Carrying capacity is the maximum population size an environment can hold. The logistic model, on the other hand, omits some important factors, such as government policies. In general, the logistic model provides more precise prediction than the exponential model does, as it includes the carrying capacity of a specific region which is ignored in the exponential one.


