Contents
Sound & Color - Using Spectrograms to Analyze Sound Signals
By: Emma Gihl
Background
A spectrogram is the visual representation of the frequency changes in a signal as they vary with time. This image can be useful when analyzing changes in frequency that cannot be easily seen in waveform view. A spectrogram is created by taking the DTFT at a certain time and displaying it vertically. This is done repeatedly to create the overall image. Spectrograms can be manipulated to analyze specific signal properties by altering the DTFT used to create it.
Wideband spectrograms limit the time window to about the length of one period for the DTFT. This increases resolution in the time domain and decreases it in the frequency domain.
Narrowband spectrograms use a longer DTFT that covers several periods of the signal. This increases resolution in the frequency domain and decreases it in the time domain.
Processing & Displaying Your Signal
In order to create your spectrogram you first need to create a series of windowed DFTs. The Matlab function 'spectrogram' makes processing & displaying a spectrogram very easy.
First generate some audio signals:
% Create a 'chirp' sound using the chirp command
t = 0:.001:3;
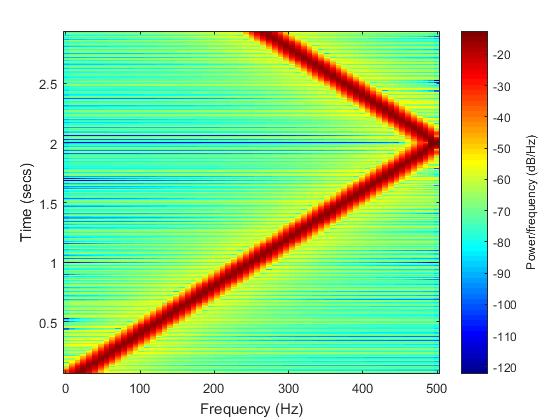
chirp1 = chirp(t,0,2,500); % creates signal sampled at 1 kHz for 3 seconds & crosses 500 Hz at t = 2 seconds
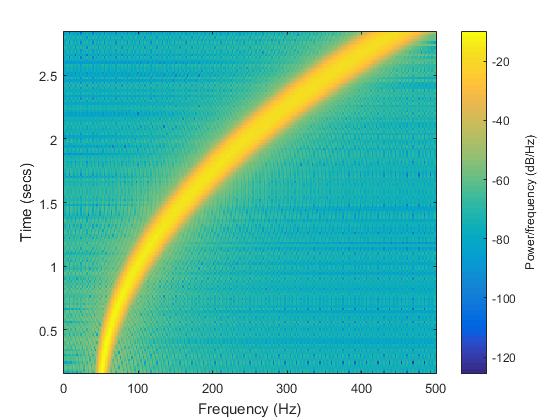
chirp2 = chirp(t,50,1.75,200,'quadratic'); % creates quadratic signal sampled at 1 kHz for 3 seconds & crosses 400 at t = 1.75 seconds
Then use the spectrogram command to create a spectrogram:
% Using a window of 120, an overlap of 120, 128 DFT sampling points, and a sampling rate of 1 kHz
spectrogram(chirp1,128,120,128,1000);
% Using a window of 320, an overlap of 300, 512 DFT sampling points, and a sampling rate of 1 kHz
spectrogram(chirp2, 320, 300, 512, 1000);
Analyzing Your Signal
Above is the spectrogram of the generated chirp1. The color spectrum represents the power frequency levels, the main "chirp" band is represented by the highest power frequency levels. The band increases steadily frequency wise, and also doubles back on itself. This can be heard in the rising pitch throughout & overlay of two distinct sounds at the end of the signal. Listen to the signal using the command:
sound(chirp1);
Similar to the spectrogram of chirp1, the power frequency levels are represented by the color spectrum. The "chirp" band is clearly quadratic in nature and that can be heard when playing the signal in its increasing pitch. Listening to this signal is easy with the command:
sound(chirp2);
Conclusion
In summary spectrograms are useful for a myriad of things when analyzing a signal. Fluctuations in pitch & frequency that cannot be easily determined with the ear or in the time domain are uncovered with ease. A visual representation of an auditory signal is a very powerful tool for understanding.
Sources
[1] Understanding Spectrograms : https://www.izotope.com/en/community/blog/tips-tutorials/2014/09/understanding-spectrograms.html
[2] Lab 9a Speech Processing : https://engineering.purdue.edu/VISE/ee438L/lab9/pdf/lab9a.pdf
[3] Matlab Documentation on Spectrogram : https://www.mathworks.com/help/signal/ref/spectrogram.html#outputarg_s


