Contents
BRITA Filter: Audio Filtration and FFT Visualizer
by Dimitri James
Introduction
Digital signal processing revolutionized the music industry in both live and recorded performances. Virtually any audio effect and instrument conceivable can be translated into a AU, VST, etc. plugin to be used in digital audio workstations. As transistor cost decreased and density increased, growth in computing power allowed effects and instruments to be used in live performances with only a few milliseconds of delay. Cheap computing has resulted in many people create music on DAWs.
One of the most popular DAWs is Ableton Live, and as its name suggests, it is capable of handling music production as well as live performance. Undoubtedly, Equalization plugins are likely the most common plugins used in songs, both during production and mastering. For those not familiar with EQ, it is simply a filter. More complex EQing is created from the sum of many filters (notch, band pass, HPF, LPF, etc) with different Q and cutoff values to achieve the exact filter response desired. Very simple filters, such as the HPF and LPF discussed in 438 are critical to achieve a particular sound.
An interest in digital audio production methods guided the decision to create a tool that would emulate 2 plugins in Ableton: AutoFilter (or EQ) and Spectrum, shown below, which apply HPF/LPF, and display the FFT of the audio track, respectively.

The goal of this project was to create an applet that would play an audio file, allow to HPF or LPF with the ability to adjust the cutoff frequency, hear the processed audio signal, and see the effect on the frequency distribution of the signal, much like what happens in a DAW.
Processing was selected to accomplish this goal; it's a language on java and designed for DSP applications. In this case, a GUI as well as real time audio playback was required, making this language and the associated audio processing libraries ideal. This program is called BRITA filter.
Unlike a real-life Brita filter whose filtertion is obfuscated from the user, my BRITA Filter shows you exactly what frequencies are being concentrated. In the next section, some quirks of implementing the BRITA Filter will be explained
Application & Implementations Notes
Please refer to BritaFilter.pde for the following code segments.
F_c is initialized at 440 Hz, but it is mapped to the horizontal position of the mouse in the window.
 fft = new ddf.minim.analysis.FFT(out.bufferSize(), out.sampleRate());
 fft.window(ddf.minim.analysis.FFT.HAMMING);
we can see the FFT depends on the sample rate (1024 Khz) by default. Secondly, FFT can have different upper and lower values depending on the spectrum of the track, which is why it can be different when switching.
 fil = new LowPassFS(centerFreq, song.sampleRate());
 song.addEffect(fil);
This is how effects are added using the minim library and their object design for audio players. It is also possible to create more complicated filter that are the sum of several LPFs and or HPFs. This can be done accidentally if the clearEffects() function isn't used prior.
FFT GUI display is based on an example in the Minim library examples, however, wider bins are used, and it is "connected" to output of the AudioPlayer object, not the input (yes, with Processing it is possible to do signal processing of your own spoken voice in real time..).
One disappointing fact is I could not find a way to plot the filter response over the as cutoff was changed with the mouse, which would help the intuitive understanding of filtering.
Results: Brita Filter (Video Demo)
Video link is below.
https://www.youtube.com/watch?v=Q5OJB8Oz0DQ
Processing offers many types of windows to be used to truncate the signal for FFT. A hamming window was used in the program. The instructions are very intuitive in switching from LP,HP, opening a new file etc.
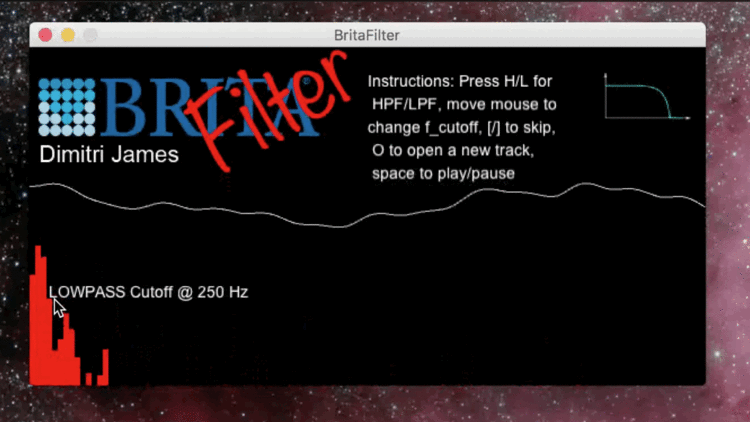
The point of this tool was to be able to visualize FFT/spectrum while filtering audio. Not only can we see the FFT response (and hear), but the top, light blue line.
The top blue line is the representation of the actual audio signal. When the cutoff approaches 100Hz in LPF operation, we can see the high frequency sinusoidal componenets in the audio be reduced dramatically. Near 70Hz, a single sine wave is visiblenon as the majority of the frequencies in the audio are cut off. The converse goes for HPF operation, where the audio signal is clearly devoid of the low-frequency sinusoids that add such a long period. compared to the High frequency signals, though this is simply due to human range of audible frequencies. For those not interested in watching a youtube video, here is a GIF of the operation.

Shown above. Compare the Audio signal with FFT as LPF cutoff goes towards 0Hz.
BRITA Filter Project download
https://github.com/commedeschatons/BUHREETA/archive/master.zip <-Zipped Project and binaries.
https://github.com/commedeschatons/BUHREETA
project github code.
Contains project and some binary compiled for OSX and Win. You are welcome to try it out. It requires JDK to be installed.
Non-copyrighted track is included in the zip.
Conclusions
The conclusion is the tool meets all of the soft specifications and goals as demonstrated in the youtube video, and is quite fun to play with.
When using four or more filters on my modern computer, the computing experience begins to get umbearable as the overhead processing inside JVM in the signal in a single-threaded Java routine becomes dominant. Thus, Processing would be good for smaller projects or demos such as this one, but not for a large DSP project. The source for DFT/FFT shows that neither do any real calculations of exponentials like we would normally do with Matlab. Instead, phase angle is calculated.
References
1. http://code.compartmental.net/minim/
2. https://processing.org/reference/
3. https://github.com/ddf/Minim

