Contents
BRITA Filter
Realtime Audio Spectrum visualizer written in Processing
by Dimitri James
Introduction
Digital signal processing revolutionized the music industry in both live and recorded performances. Virtually any audio effect and instrument conceivable can be translated into a AU, VST, etc. plugin to be used in digital audio workstations. As transistor cost decreased and density increased, growth in computing power allowed effects and instruments to be used in live performances with only a few milliseconds of delay. Cheap computing has resulted in many people create music on DAWs.
One of the most popular DAWs is Ableton Live, and as its name suggests, it is capable of handling music production as well as live performance. Undoubtedly, Equalization plugins are likely the most common plugins used in songs, both during production and mastering. For those not common with EQ, it is simply a filter. More complex EQing is created from the sum of many filters (notch, band pass, HPF, LPF, etc) with different Q and cutoff values to achieve the exact filter response desired. Very simple filters, such as the HPF and LPF discussed in 438 are extremely common to achieve a particular sound.
An interest in digital audio production methods guided the decision to create a tool that would emulate 2 plugins in Ableton: AutoFilter (or EQ) and Spectrum, shown below, which apply HPF/LPF, and display the FFT of the audio track, respectively.
 The goal of this project was to create an applet that would play an audio file, allow to HPF or LPF with the ability to adjust the cutoff frequency, hear the processed audio signal, and see the effect on the frequency distribution of the signal, much like what happens in a DAW.
Processing was selected to accomplish this goal; it's a language on java and designed for DSP applications. In this case, a GUI as well as real time audio playback was required, making this language and the associated audio processing libraries ideal. This program is called BRITA filter.
Unlike a real-life Brita filter whose filteration is obfuscated from the user, my BRITA Filter shows you exactly what frequencies are being concentrated. In the next section, Using the BRITA Filter will be explained
Brita Filter (w/ Video Demo)
 Processing offers many types of windows to be used to truncate the signal for FFT. A hamming window was used in the program.
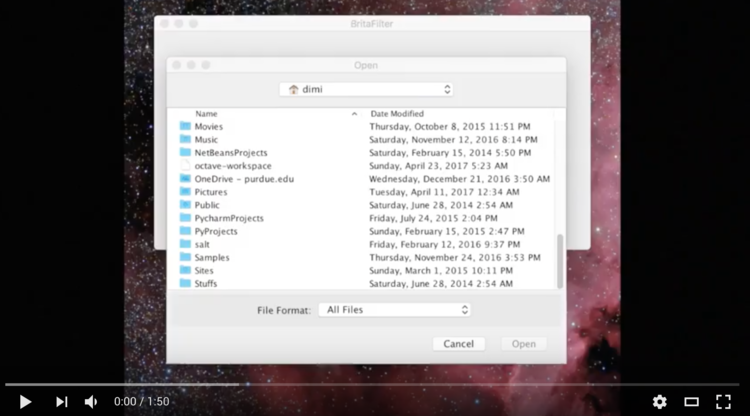
The instructions are very intuitive in switching from LP,HP, opening a new file etc.
The point of this tool was to be able to visualize FFT/spectrum while filtering audio. Not only can we see the FFT response (and hear), but the top, light blue line.
The top blue line is the representation of the actual audio signal. When the cutoff approaches 100Hz in LPF operation, we can see the high frequency sinusoidal componenets in the audio be reduced dramatically. Near 70Hz, a single sine wave is visible as the majority of the frequencies in the audio are cut off. The converse goes for HPF operation, where the audio signal is clearly devoid of the low-frequency sinusoids that add such a long period. compared to the High frequency signals, though this is simply due to human range of audible frequencies.
The BRITA Filter
(To do: insert circuit diagram, input and output signals)
2. Analog Delay: This is a difficult circuit to implement. You have to use a delay line IC and it is still hard to have a good signal to noise ratio in this scenario.
References
1. Analog Distortion: This is an easy circuit to implement with an amplifier and clipping diodes.
(To do: insert circuit diagram, input and output signals)
2. Analog Delay: This is a difficult circuit to implement. You have to use a delay line IC and it is still hard to have a good signal to noise ratio in this scenario.

