Animated Aliasing Example
ECE301 student project
As shown in the Sampling Theorem entry, a signal must be sampled greater than the Nyquist Rate in order to reconstruct the original signal. The effect of undersampling, or sampling at a rate below that of the Nyquist Rate, is aliasing. The example used in class was that of a spinning wheel.
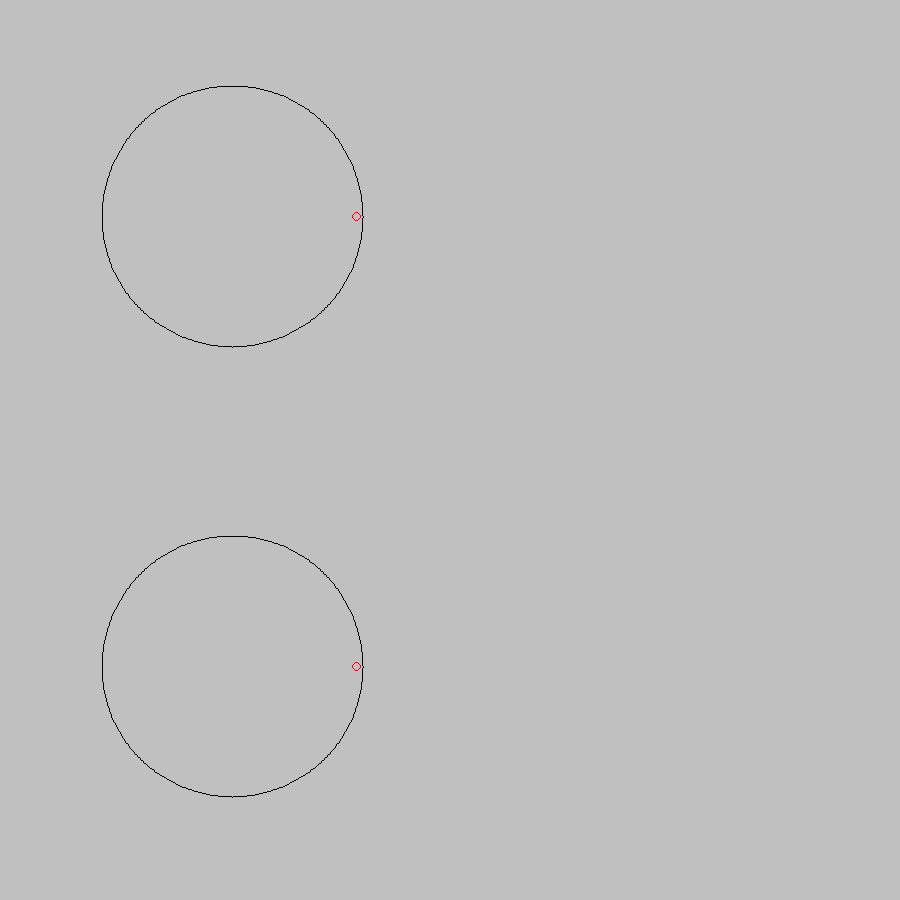
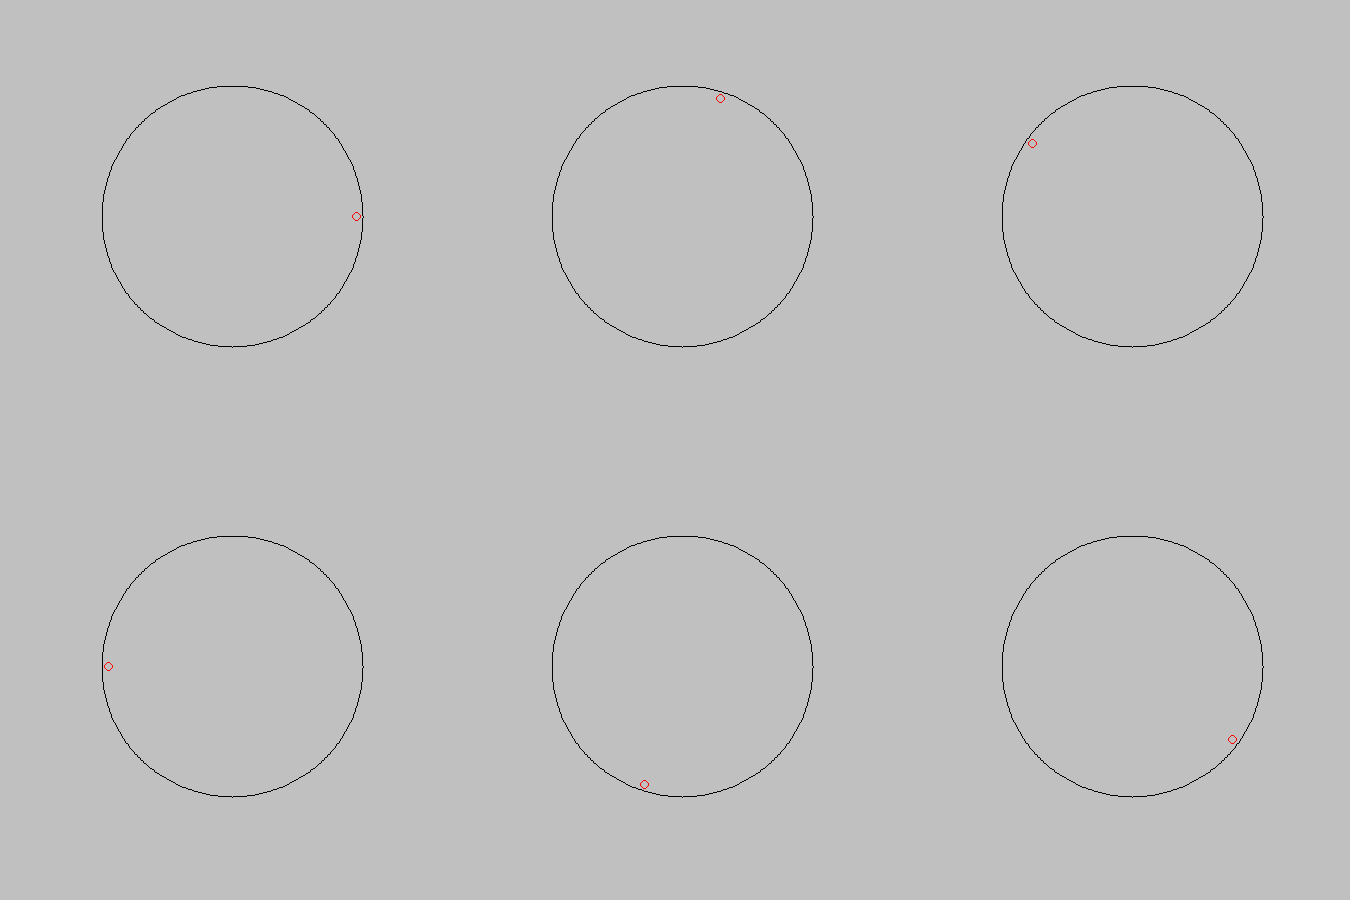
Below is an animation that shows the spinning wheel example in greater detail. The wheel is spinning in the clockwise direction at a rate of 5 sec/rev which corresponds to a frequency of .2 rev/sec. This frequency is the frequency of the signal. The small red dot is just an indicator on a part of the wheel to make it easy to see how the wheel is spinning. In each of the following three cases, the wheel is observed at snap shots in time by using a strobe light. Each case has a different strobe light frequency. This frequency is our sampling frequency.
Case 1: Sampling Frequency (Strobe Light Frequency) = 2 samples/sec (Strobe Flashes Once every .5 Seconds)
- Since the sampling frequency is greater than the Nyquist Rate (The frequency is actually 10 times that of the spinning frequency), then our signal should be able to be reconstructed.
Case 2: Sampling Frequency (Strobe Light Frequency) = .2 samples/sec (Strobe Flashes Once every 5 Seconds)
- Since the sampling frequency is the same as the spinning wheel frequency, (less than the Nyquist Rate) we can expect the motion of the wheel to not be reconstructed properly. Since the sampling frequency is the same as the frequency of the spinning wheel, the wheel appears to be motionless, even though it is still spinning at .2 rev/sec.
Case 3: Sampling Frequency (Strobe Light Frequency) = 2/9 samples/sec (Strobe Flashes Once every 4.5 Seconds)
- In this case, the sampling frequency is higher than that of the frequency of the spinning wheel, but it is again below the Nyquist Rate, so we can expect the motion of the wheel to not be reconstructed properly. Since the sampling frequency is slightly greater than the wheel's frequency, the wheel appears to be spinning backwards.
Note: Watch Carefully, the dot moves very slowly
Discussion
Look! This page is now referenced and reviewed on Stumbleupon! See here


