Minimum Spanning Tree Methods (MST)
One can find MST using Prim's Algorithm (fast test '57) or Krusal's Algorithm
Zahn's clustering algorithm (1971)
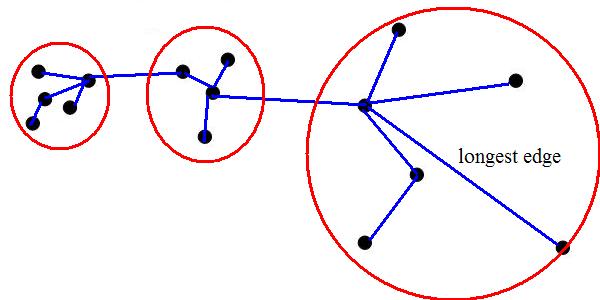
- Find MST
- Identify "inconsistent" edges in MST and remove them.
e.g. remove the longest edge
1 edge removed=> 2 clusters
2 edges removed=> 3 clusters
What if you have?
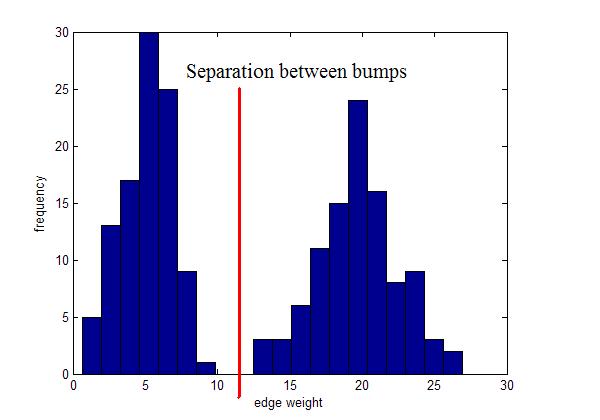
Instead, use "local" inconsistency remove edges significantly larger than their neighborhood edges.
Use for visualization
Visualizations of hierarchical clustering
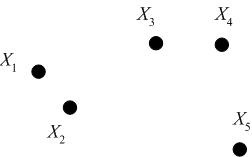
Consider the following set of five 2D data points, which we seek to cluster hierarchically.
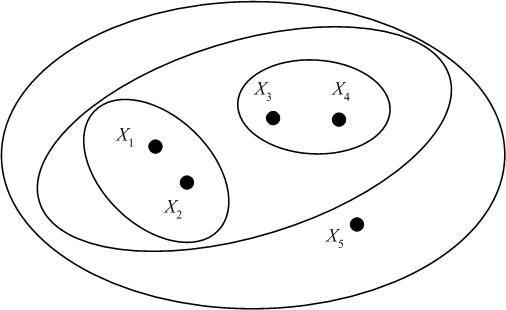
We may represent the hierarchical clustering in various ways. One is by a Venn diagram, in which we circle the data points which belong to a cluster, then subsequently circle any clusters that belong to a larger cluster in the hierarchy.
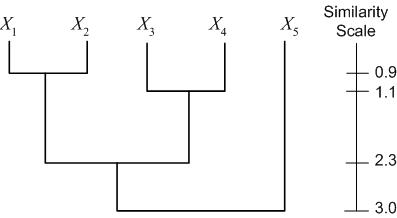
Another representation is a dendogram. A dendogram represents the clustering as a tree, with clusters that are more closely grouped indicated as siblings "earlier" in the tree. The dendogram also includes a "similarity scale," which indicates the distance between the data points (clusters) which were grouped to form a larger cluster. For the example dataset above (with distances calculated as Euclidian distance), we have the following dendogram:
A third representation of hierarchical clustering is by using brackets. We bracket data points/clusters which are grouped into a cluster in a hierarchical fashion as follows: $ \{\{\{X_1,X_2\},\{X_3,X_4\}\},X_5\} $
Agglomerate Algorithms for Hierarchical Clustering (from Distances)
Reference - Chapter 3.2 from Jain and Dudes
Begin with a matrix of pairwise distances.
Step 1) Begin with clusters $ S1{X1}, S2{X2},.., Sd{Xd} $ Step 2) Find the two nearest clusters $ Sio, Sjo $ and merge them into a single cluster Step 3) Repeat step 2 until the number of clusters reaches a pre-specified number (the number 1 corresponds to a dendogram)

