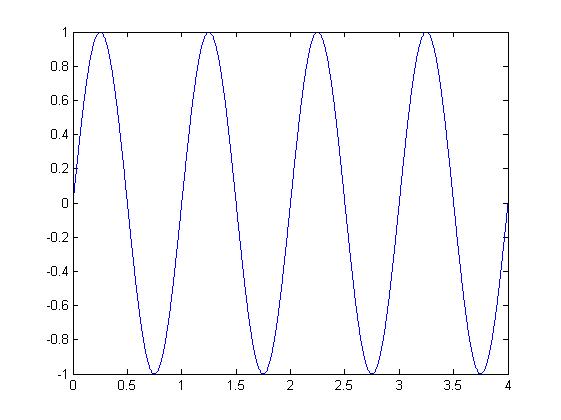
A-1 Creating two DT signals (one periodic and one non-periodic) from a periodic CT signal
I choose $ x(t) = sin (2\pi t), $ which is a periodic CT signal
original plot:

I choose $ x(t) = sin (2\pi t), $ which is a periodic CT signal
original plot:

