Sampling of CT Signal to Yield a DT Signal
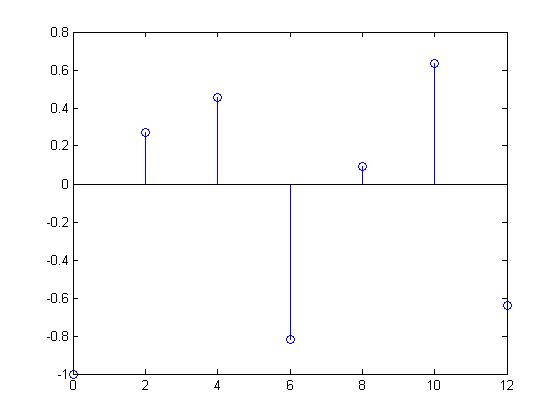
Periodic Signal sampled to become Non-Periodic:
Matlab Code:
clc
clear all
t = 0:2:4*pi;
x = sawtooth(t,.5);
stem(t,x)
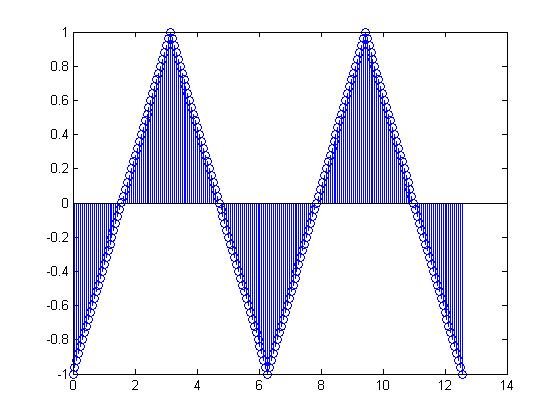
Periodic Signal sampled to remain Periodic:
Matlab Code:
clc
clear all
t = 0:pi/50:4*pi;
x = sawtooth(t,.5);
stem(t,x)
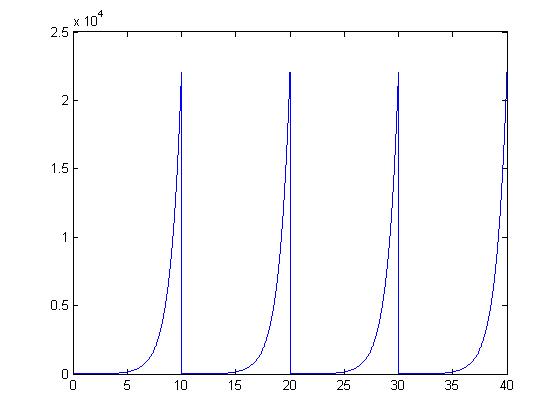
Creation of a Periodic Signal from a Non-Periodic Signal
The signal used to obtain this graph was $ \ x(t) = e^{t} $
Here is the Matlab code to generate the graph:
t = [0:.001:10];
x = exp(t);
for n = 1:1:2
    t = [t t + n*10];
    x = [x x];
end

plot(t,x);


