Contents
Fourier Transforms
Author: Luke Oxley
Table of Contents:
- Introduction
- Euler’s Formula
- Formula Visualization
- Example
- Inverse Transform
- Applications
- References and Further Reading
Introduction
The Fourier transform is a method used to break a function down into a representation of its frequencies. This method can be thought of as transforming from the time domain (a function with time as the input variable) to the frequency domain (a function with frequency as the input). This function in the frequency domain is a way of representing how much of each frequency is prevalent in the function. The Fourier transform allows for signals to be broken into their individual frequency components. The advantage of extracting the individual frequencies is that this allows for the individual manipulation of each frequency and for a unique representation of the function. Once you have extracted the component frequencies, many times it is possible to express the original function with sine and cosine waves at these frequencies. I like to picture this representation as a Taylor series, but instead of being based on derivatives, it is based on frequencies. This transform is useful in many fields, especially for analyzing electrical and sound signals. The purpose of this page is for you to gain an understanding of the basics of this transform, including a way to mentally visualize what this formula is doing and its applications.
One area of confusion is the difference between the Fourier series and the Fourier transform. The Fourier transform can be thought of as a limited case of the Fourier series. The series is mainly concerned with periodic functions while the transform is concerned with nonperiodic functions.
Euler's Formula
To understand the formula for the Fourier transform, it is helpful to have knowledge of Euler’s formula:
$ e^{it} = \cos t + i\sin t $
One way of representing a unit circle is parametrically with sines and cosines:
$ x = \cos t $
$ y = \sin t $
Euler’s formula allows for an elegant representation of a unit circle in the complex plane. Instead of using sines and cosines like in our parameterization, these can be substituted out with a simpler expression of $ e^{it} $. Another nice thing about Euler’s formula is that since it represents a unit circle where t is the angle in radians, t also represents the arclength traveled around the circle.
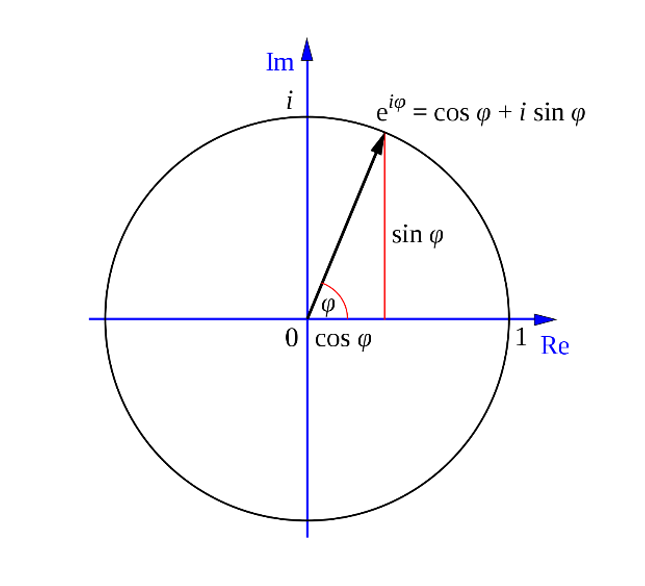
Furthermore, the period of a full revolution around the circle in this formula is 2π radians. To convert this period into a desired frequency, we add a coefficient of 2πf to the exponent, where f is the desired number of rotations per second around the circle:
$ e^{2\pi ift} = \cos 2\pi ft + i\sin 2\pi ft $
Formula Visualization
As previously stated, the Fourier transform converts a function from the time domain to the frequency domain. To do this, we need to have a way to extract the amount of each frequency contained in the function. Personally, when learning a new concept, I find it helpful, when possible, to visualize it. For example, I will break the Fourier transform formula into components and explain where they come from. First, we will start with Euler’s formula containing the frequency variable:
$ e^{-2\pi ift} $
Currently, we have a circle with a radius of one, determined by the coefficient of e, and frequency f. The negative in the exponent makes an increasing time t correlate to clockwise motion around the circle. Now, picture yourself taking a function and wrapping it around this circle at a certain frequency. For example, let $ g(t) = \sin(3*2\pi t) + 1 $ (graph pictured below). To wrap g(t) around the circle, we must make the radius determined by g(t). Since the coefficient of e is the radius of the circle, we make g(t) the coefficient:
$ g(t)e^{-2\pi ift} $
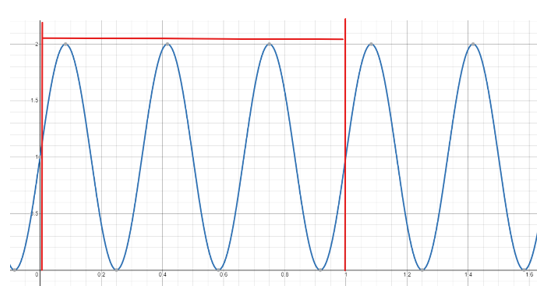
If we wrap g around the circle at a frequency f = 1, we are basically snipping a section of the graph from t = 0 to t = 1 (between the red lines) and making one complete revolution:
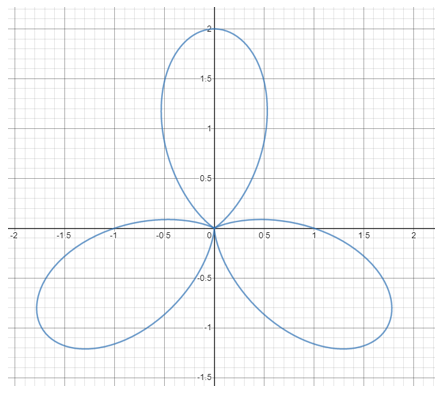
Notice how there are three peaks on g(t), from t = 0 to t = 1, correlating to three petals on our wrapped version. Now, we will wrap the function around the circle with f = 2. We are taking the same snippet as before, but forming two complete revolutions with it around the circle:
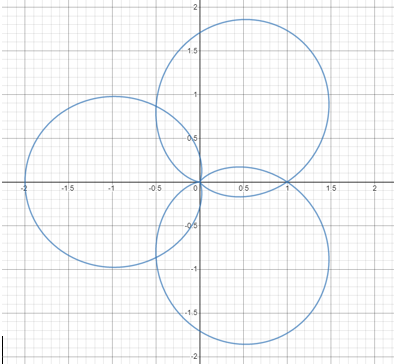
Again, we do this with f = 3, the same frequency of g. We wrap the snippet around the circle three times. As g makes three “hills” in one second, we will form three revolutions from t = 0 to t = 1. This results in each “hill” overlapping, forming one distinct shape:
