TWO DIMENSIONAL SIGNALS
Some 2D signals are $ \ \delta\left (\mathit{x}, \mathit{y}\right ) $,Rect$ \left (\mathit{x}, \mathit{y}\right ) $,Sinc$ \left (\mathit{x}, \mathit{y}\right ) $.One important property of 2D functions is that they are separable,when they are a product of two 1D signals.They are of the form :
$ \ \mathbf{f}\left (\mathit{x}, \mathit{y}\right )=\mathbf{g}\left (\mathit{x}\right )\mathbf{h}\left (\mathit{y}\right) $
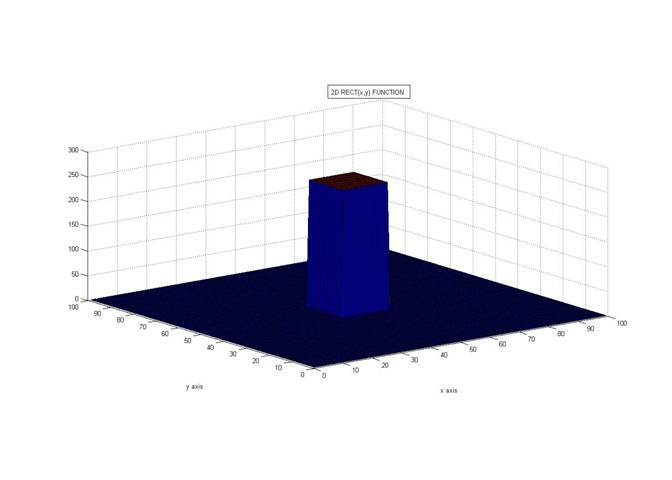
Rect$ \left (\mathit{x}, \mathit{y}\right ) = \begin{cases} 1, & \mbox{if }|x|,|y|\mbox{ is less than 1} \\ 0, & \mbox{ }\mbox{ else} \end{cases} $
The rect 2D function looks like a box .

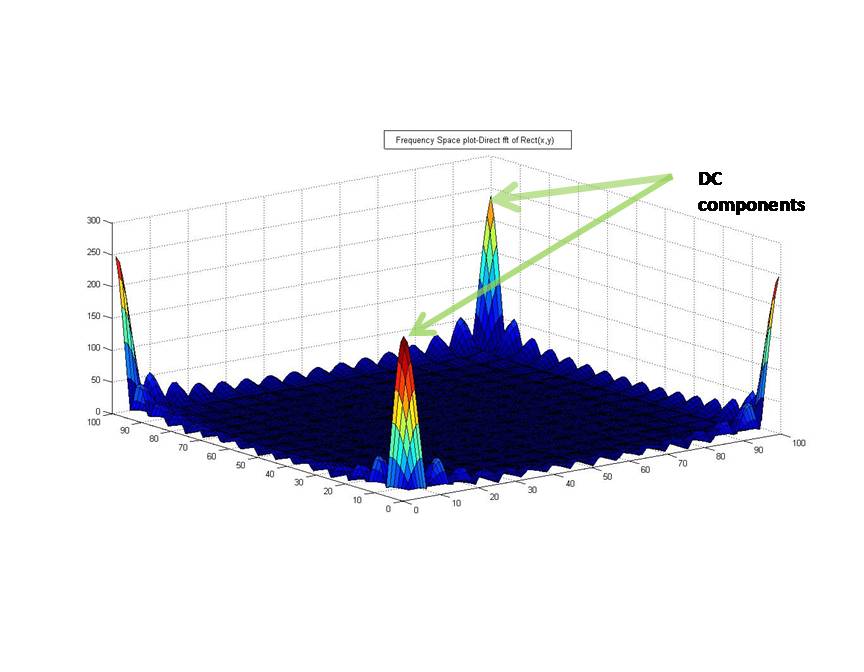
A fourier transform of a rect function is a product of 2 Sinc functions.In the frequency space plot.The high'DC' components of the rect function lies in the origin of the above plot and on the fourier transform plot,those DC components should coincide with the center of the plot.But with a direct fft approach,the plot doesnt look like the expected fft graph.


