The code given by the assignment was to plot 13 cycles of a 13Hz sinusoid.
F0 =13;
T0 =1/F0;
Ts = 0.07;
t  = 0:Ts:13*T0;
x = real(exp(j*(2*pi*F0*t-pi/2)));
plot(t,x)
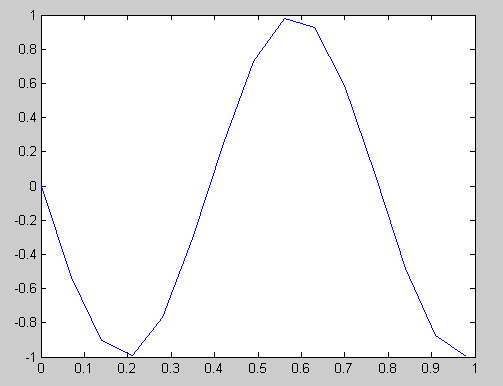
The resulting graph:
As you can see, over one second, the graph completes only a little bit more than one cycle. It should have thirteen cycles instead. The reason would be that the time step, Ts, was set too high and therefore was not allowing for enough values to be calculated. The remedy would be to decrease the time step by many magnitudes. Due to the fact that there needs to be 1/13 second for a cycle to complete, I decided that there should be least 1000 time steps per cycle, which gives us 13000 samples per second.
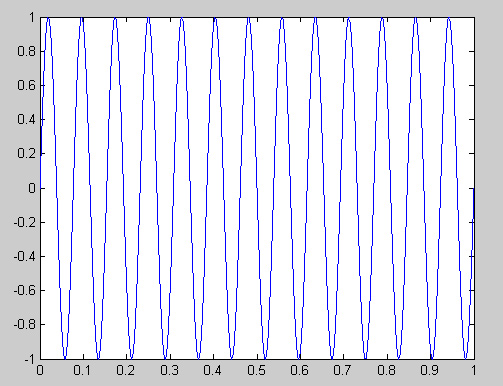
Ts was changed to 1/13000 instead of 0.07:
F0 =13;
T0 =1/F0;
Ts = 1/13000;
t  = 0:Ts:13*T0;
x = real(exp(j*(2*pi*F0*t-pi/2)));
plot(t,x)
The resulting graph actually has 13 cycles over one second of time:


