(→Part A) |
(→Part A) |
||
| Line 1: | Line 1: | ||
== Part A == | == Part A == | ||
| + | |||
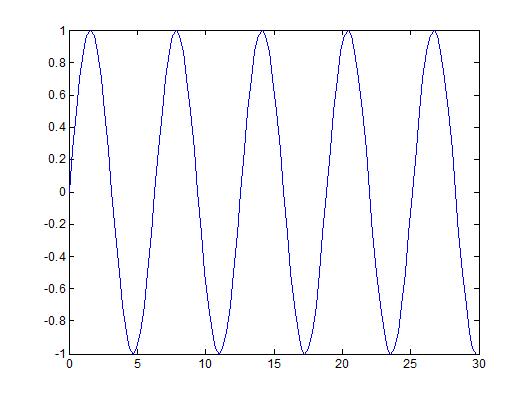
| + | The original signal shown in the first plot is y(x) = sin(t) with a period of <math>2\pi</math> | ||
[[Image:sahw1a2_ECE301Fall2008mboutin.jpg]] | [[Image:sahw1a2_ECE301Fall2008mboutin.jpg]] | ||
[[Image:sahw1a1_ECE301Fall2008mboutin.jpg]] [[Image:sahw1a3_ECE301Fall2008mboutin.jpg]] | [[Image:sahw1a1_ECE301Fall2008mboutin.jpg]] [[Image:sahw1a3_ECE301Fall2008mboutin.jpg]] | ||
Revision as of 16:58, 10 September 2008
Part A
The original signal shown in the first plot is y(x) = sin(t) with a period of $ 2\pi $


