| Line 8: | Line 8: | ||
<center>[[File: Laplacegraph1.gif]]</center> | <center>[[File: Laplacegraph1.gif]]</center> | ||
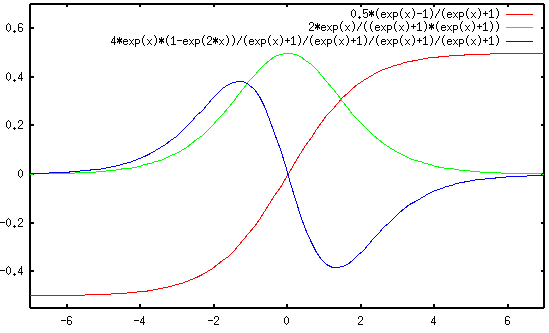
| + | Take, for example, the above graph. Along the x-axis is a row or column of pixels. Along the y-axis is the relative brightness of the pixels. The red line graphs the relative brightness of the pixel over the position, the green line the first derivative, and the blue line the second derivative, which is analogous to the Laplace operator. | ||
[[Walther_MA271_Fall2020_topic9|Back to main page]] | [[Walther_MA271_Fall2020_topic9|Back to main page]] | ||
Revision as of 21:42, 6 December 2020
Applications: Image Processing
In image processing, it is often necessary to find edges of shapes. Images are, by nature, complex maps of pixels, and thus can be very difficult for a computer to interpret and reduce into simple information. The Laplace operator is a tool used to solve some of these problems.
Consider, for example, a self-driving car. This vehicle must be able to interpret from an image what another object is, such as a car, stop sign, or pedestrian. Thus, edge detection is an important aspect of image processing. The Laplace operator is the perfect tool for this.

Take, for example, the above graph. Along the x-axis is a row or column of pixels. Along the y-axis is the relative brightness of the pixels. The red line graphs the relative brightness of the pixel over the position, the green line the first derivative, and the blue line the second derivative, which is analogous to the Laplace operator. Back to main page

