| Line 15: | Line 15: | ||
[[File:Graph1.3.PNG|time reversal]] | [[File:Graph1.3.PNG|time reversal]] | ||
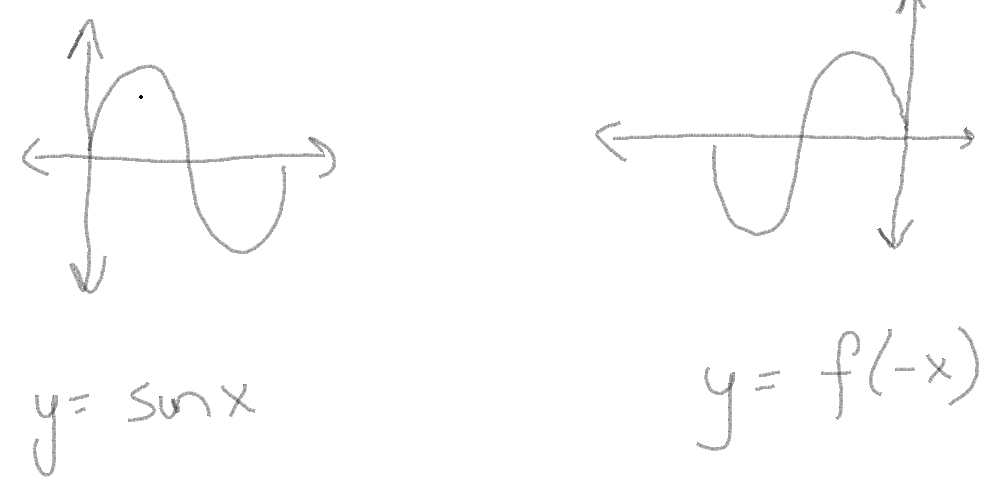
When you negate the independent variable, the graph of the dependent variable changes to a mirror image of the original graph. | When you negate the independent variable, the graph of the dependent variable changes to a mirror image of the original graph. | ||
| + | |||
| + | Even/Odd Signals- | ||
| + | [[File:Graph1.4.PNG]] | ||
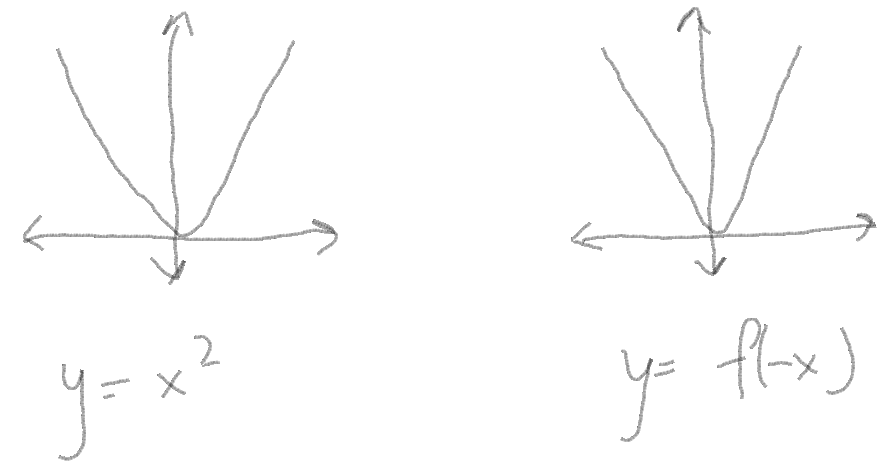
| + | As can be seen in the above function, the graphs do not change when you substitute x as -x. Similarly in signals, when a signal remains unchanged under time negation, it is termed as an "even" signal. | ||
Revision as of 20:13, 1 December 2018
Time dependent changes-
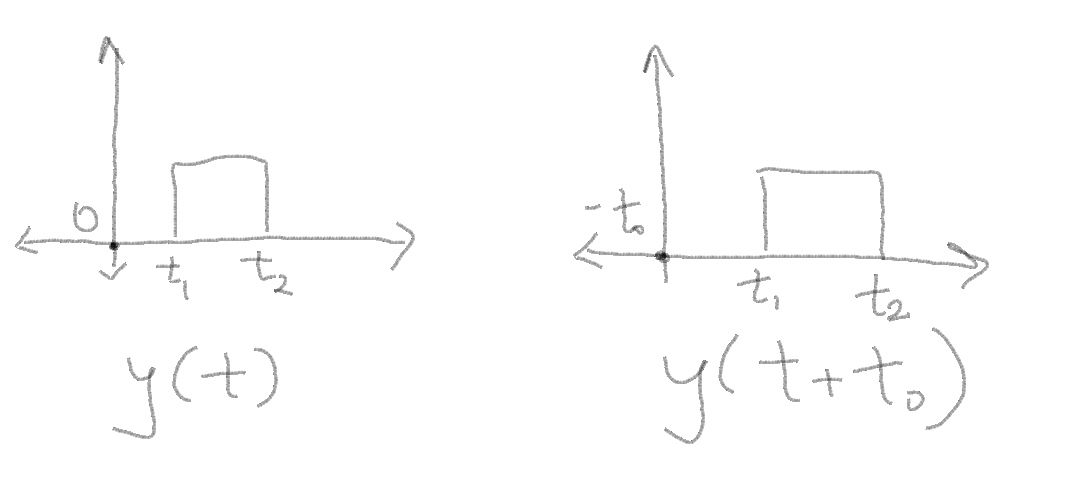
1. Time delay- In simple terms you are shifting the original signal by a factor. For eg.
In this example as you can see, a simple way of understanding time shift/delay is by looking at how the graph changes when you want a shift in the signal.
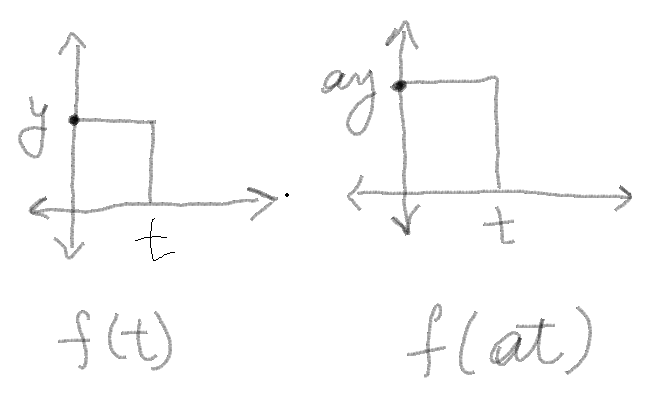
In simple terms you are shifting the height/width of the graph of a signal. The change in graph depends on the value of a. If |a|>0, then the height increases, else it decreases.
3. Time reversal-

Even/Odd Signals-


