| Line 17: | Line 17: | ||
[[File:PdgInAction.PNG|400px| Parametric Data Set Generator in action]]<br /> | [[File:PdgInAction.PNG|400px| Parametric Data Set Generator in action]]<br /> | ||
| + | |||
| + | General Directions: | ||
| + | * Launch the Java .jar file | ||
| + | * Input a parametric data set (draw a cool picture!) | ||
| + | * save the data as a .csv | ||
| + | * update the .csv and the .avi filenames in the ECE301RunPFSCV.m script; if the data set you entered was periodic (you connected the first and last points), set 'periodicity' to 1. Otherwise, set it to 0. | ||
| + | * (in MATLAB) Run the script! That's it! | ||
| + | |||
| + | You will need: [[File:FSCBPallen388.zip]] | ||
| + | |||
| + | Notes: you will likely need to move the files in the .zip file into a new folder before running any of them. The MATLAB files run nicely in R2017b, and the Java Application was built for Java 10.0.1. | ||
[[2018_Fall_ECE_301_Boutin | Back to ECE 301, Fall 2018]] | [[2018_Fall_ECE_301_Boutin | Back to ECE 301, Fall 2018]] | ||
Revision as of 22:26, 11 November 2018
Convergence of Parametric Fourier Series Approximations
Author: Stone Allen
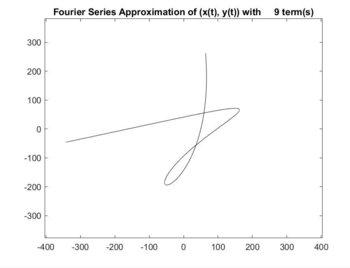
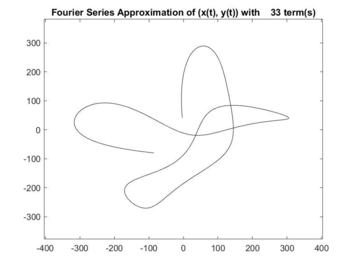
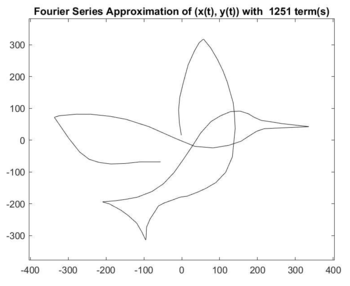
This project consists primarily of a MATLAB function and complementary Java application. Its objective is to demonstrate the ability of Fourier Series to approximate an arbitrary data set, with increasing precision, and to show the convergence of the Fourier approximation onto the original data. The result is an interactive set of programs which illustrate this convergence geometrically with discrete parametric equations. Users can select a set of two signals, (x(t), y(t)), which are steadily reconstructed using more and more terms of their Fourier Series and displayed graphically via MATLAB.


Full video: Hummingbird.avi
The MATLAB function performs the following:
- Computes the discrete Fourier Series coefficients (a1 through aN) for X(t) and Y(t)
- Begins reconstructing both X(t) and Y(t) using only a0, then adds the a-1 and a1 complex exponential terms as a pair
- Adds the a-i and ai in pairs for 1 ≤ i ≤ floor((N - 1) / 2).
- if N even, adds the aN / 2 term at the end
- periodically graphs approximations and compiles them into a video, which is displayed onscreen (and saved)
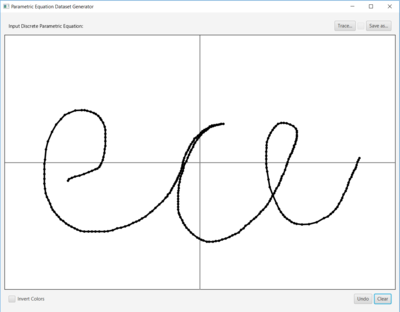
The Java Application allows the user to create graphical parametric data sets and save them for use with the MATLAB script. Its use is fairly straightforward. If desired, the user may select an image to "trace" in a parametric data set, or simply construct one on white space.
General Directions:
- Launch the Java .jar file
- Input a parametric data set (draw a cool picture!)
- save the data as a .csv
- update the .csv and the .avi filenames in the ECE301RunPFSCV.m script; if the data set you entered was periodic (you connected the first and last points), set 'periodicity' to 1. Otherwise, set it to 0.
- (in MATLAB) Run the script! That's it!
You will need: File:FSCBPallen388.zip
Notes: you will likely need to move the files in the .zip file into a new folder before running any of them. The MATLAB files run nicely in R2017b, and the Java Application was built for Java 10.0.1.


