| Line 5: | Line 5: | ||
The code for this graph is like below. | The code for this graph is like below. | ||
| − | + | samples_step = 3; | |
| − | samples_step = 3; | + | num_samples = samples_step:samples_step:10000; |
| − | num_samples = samples_step:samples_step:10000; | + | len = length(num_samples); |
| − | len = length(num_samples); | + | mu = 0; |
| − | mu = 0; | + | sigma = 5; |
| − | sigma = 5; | + | muhat = zeros(1, len); |
| − | muhat = zeros(1, len); | + | sigmahat = zeros(1, len); |
| − | sigmahat = zeros(1, len); | + | for x = num_samples |
| − | for x = num_samples | + | data = mu + sigma * randn(1, x); |
| − | + | phat = mle(data(1, :)); | |
| − | + | muhat(1, x/samples_step) = phat(1); | |
| − | + | sigmahat(1, x/samples_step) = phat(2); | |
| − | + | end | |
| − | end | + | plot(num_samples, muhat); |
| − | plot(num_samples, muhat); | + | hold on; |
| − | hold on; | + | plot(num_samples, sigmahat); |
| − | plot(num_samples, sigmahat); | + | |
| − | + | ||
--[[User:Han84|Han84]] 22:49, 2 April 2010 (UTC) | --[[User:Han84|Han84]] 22:49, 2 April 2010 (UTC) | ||
Revision as of 18:06, 2 April 2010
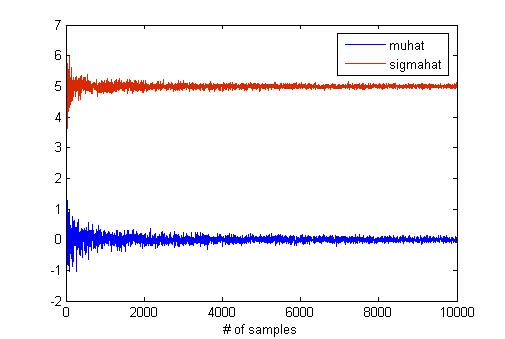
MATLAB has a "mle" function for maximum likelihood estimation. I think that this function is useful to verify the result of hw2 if you have MATLAB. I try to find the effect of the sample size in MLE using "mle" function because the number of samples is critical for estimation. To do this, I generate samples from normal distribution with mean as 0 and std as 5. The below graph shows the results of MLE according to the number of samples.
The code for this graph is like below.
   samples_step = 3;
   num_samples = samples_step:samples_step:10000;
   len = length(num_samples);
   mu = 0;
   sigma = 5;
   muhat = zeros(1, len);
   sigmahat = zeros(1, len);
   for x = num_samples
       data = mu + sigma * randn(1, x);
       phat = mle(data(1, :));
       muhat(1, x/samples_step) = phat(1);
       sigmahat(1, x/samples_step) = phat(2);
   end
   plot(num_samples, muhat);
   hold on;
   plot(num_samples, sigmahat);
--Han84 22:49, 2 April 2010 (UTC)


