| Line 25: | Line 25: | ||
| − | The DC components are at the corners of the frequency space plot. | + | The DC components are at the corners of the frequency space plot.However with fftshift function the image can be pre and post processed to move the DC components in the center of the fourier transform.So that the FT plots looks like the expected plot.The rect function is first shifted in the image plot and then 2 dimensional fft is applied on the shifted rect function.The fft is again shifted to render the expected plot. |
With fftshift,FT looks like: | With fftshift,FT looks like: | ||
[[Image:img10.jpg]] | [[Image:img10.jpg]] | ||
| Line 38: | Line 38: | ||
It looks like a cylinder in the 2D .The topview appears like a circle. | It looks like a cylinder in the 2D .The topview appears like a circle. | ||
[[Image:img12.jpg]][[Image:img13.jpg]] | [[Image:img12.jpg]][[Image:img13.jpg]] | ||
| + | The approach of direct fft and shifted fft is applied to get the appropriate results. | ||
[[Image:img14.jpg]][[Image:img15.jpg]] | [[Image:img14.jpg]][[Image:img15.jpg]] | ||
| + | |||
| + | == Results == | ||
| + | To get the fft of the 2D signals,a direct fft is not the correct approach ,as the DC components instead of lying in the center,lies at the corners.To avoid it and get the correct fft,fftshift is used. | ||
| + | |||
| + | ---- | ||
| + | --[[User:Apanja|Apanja]] 03:59, 6 November 2009 (UTC)Ananya Panja | ||
Revision as of 23:59, 5 November 2009
TWO DIMENSIONAL SIGNALS
Some 2D signals are $ \ \delta\left (\mathit{x}, \mathit{y}\right ) $,Rect$ \left (\mathit{x}, \mathit{y}\right ) $,Sinc$ \left (\mathit{x}, \mathit{y}\right ) $.One important property of 2D functions is that they are separable,when they are a product of two 1D signals.They are of the form :
$ \ \mathbf{f}\left (\mathit{x}, \mathit{y}\right )=\mathbf{g}\left (\mathit{x}\right )\mathbf{h}\left (\mathit{y}\right) $
Rect$ \left (\mathit{x}, \mathit{y}\right ) = \begin{cases} 1, & \mbox{if }|x|,|y|\mbox{ is less than 1} \\ 0, & \mbox{ }\mbox{ else} \end{cases} $
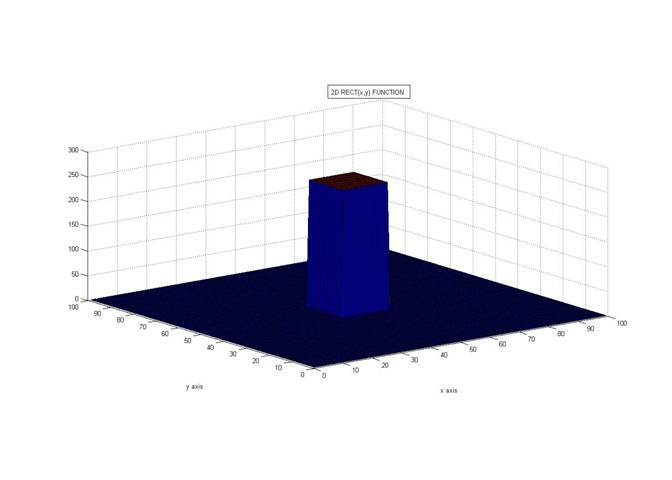
The rect 2D function looks like a box .
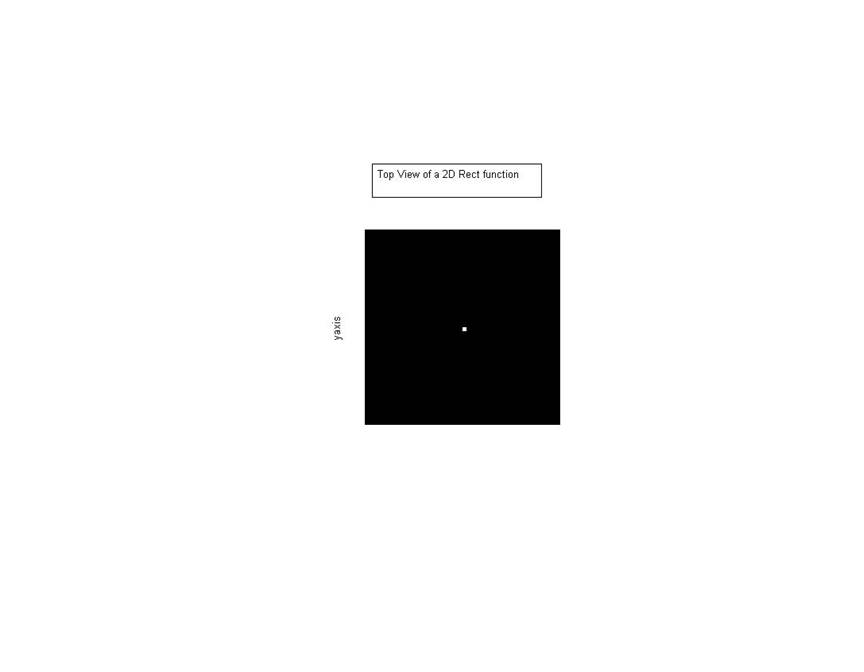
The top view of the rect function looks like:Like a pixel
A fourier transform of a rect function is a product of 2 Sinc functions.The high'DC' components of the rect function lies in the origin of the image plot and on the fourier transform plot,those DC components should coincide with the center of the plot.But with a direct fft approach,the plot doesnt look like the expected fft graph.The DC components are found on the edges instead.
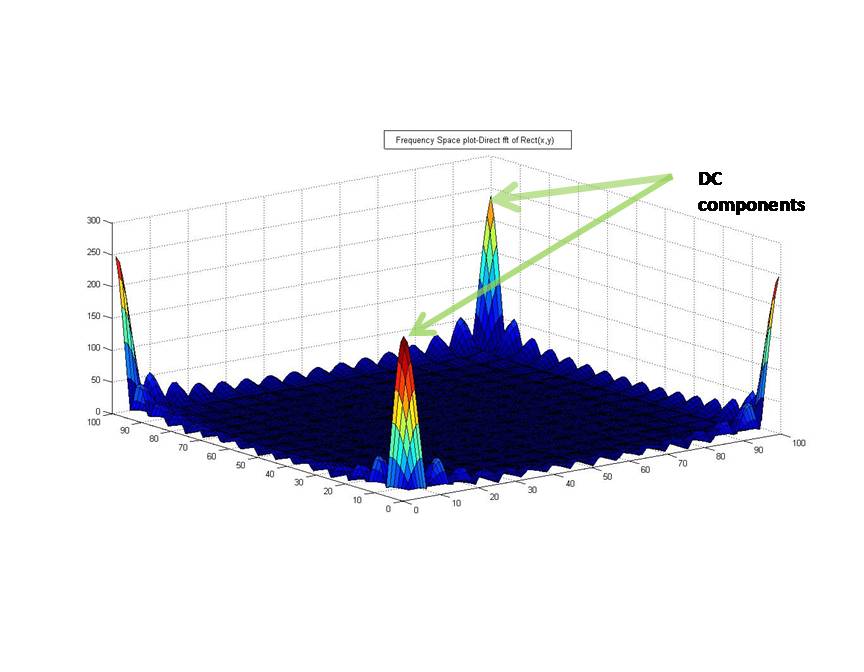
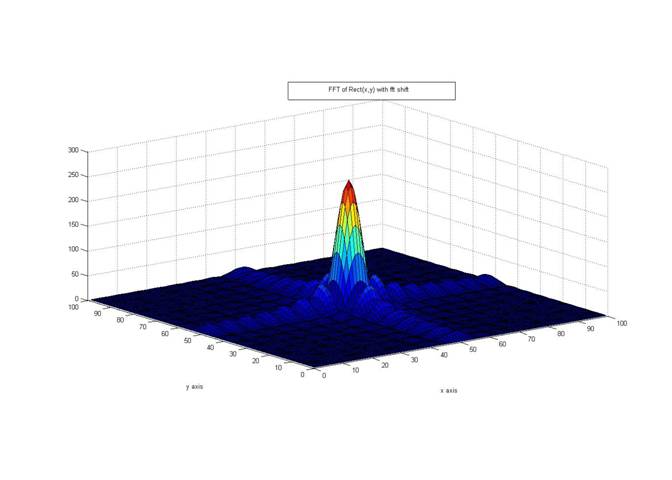
The DC components are at the corners of the frequency space plot.However with fftshift function the image can be pre and post processed to move the DC components in the center of the fourier transform.So that the FT plots looks like the expected plot.The rect function is first shifted in the image plot and then 2 dimensional fft is applied on the shifted rect function.The fft is again shifted to render the expected plot.
With fftshift,FT looks like:
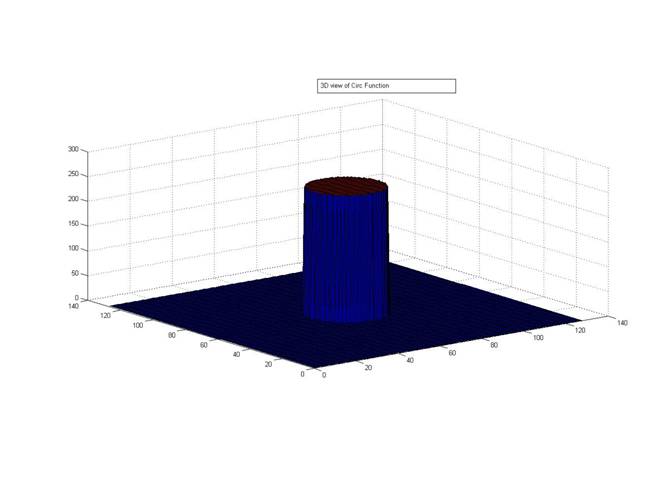
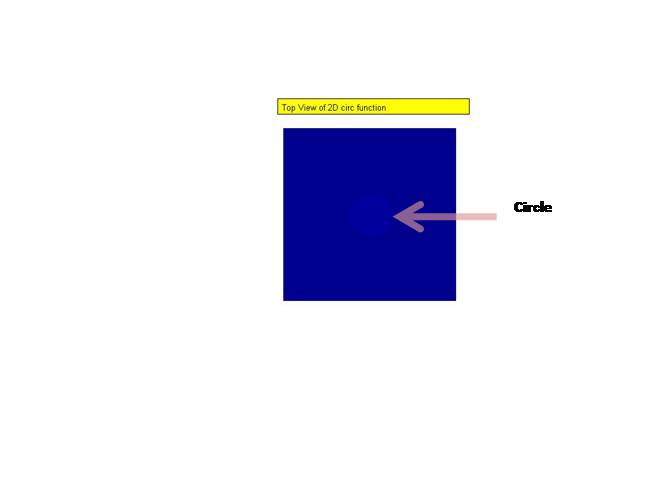
Another 2D function is Circ function.It is not separable into product of 2 1D functions Circ$ \left (\mathit{x}, \mathit{y}\right ) = \begin{cases} 1, & \mbox{if }\sqrt{x^2 +y^2} \mbox{ is less than 1} \\ 0, & \mbox{ }\mbox{ else} \end{cases} $
It looks like a cylinder in the 2D .The topview appears like a circle.
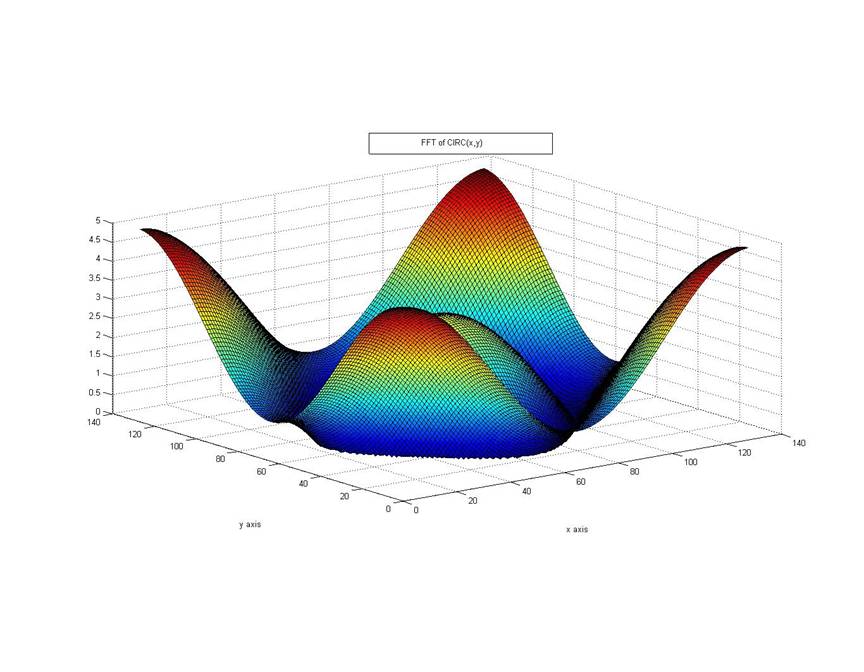
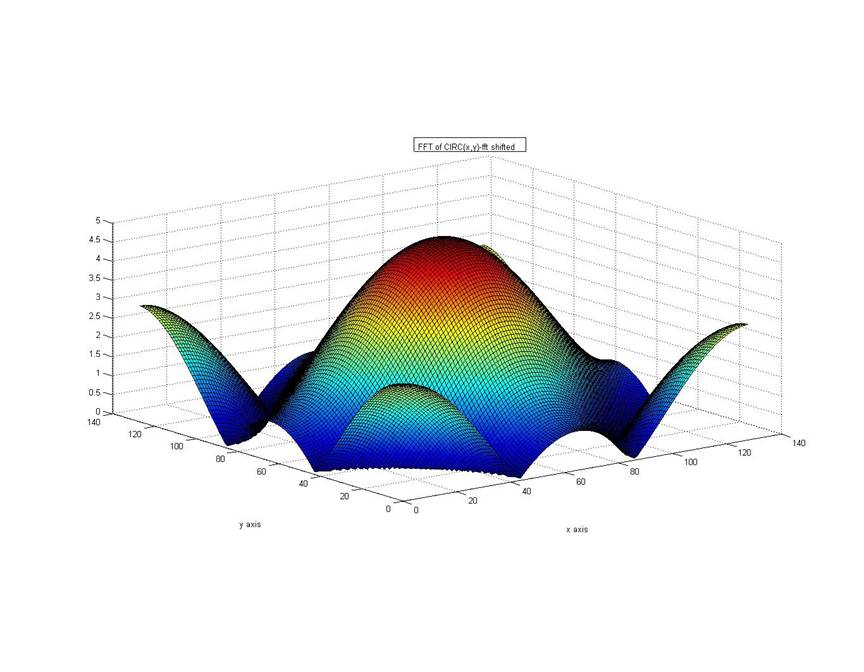
 The approach of direct fft and shifted fft is applied to get the appropriate results.
Results
To get the fft of the 2D signals,a direct fft is not the correct approach ,as the DC components instead of lying in the center,lies at the corners.To avoid it and get the correct fft,fftshift is used.
--Apanja 03:59, 6 November 2009 (UTC)Ananya Panja

