(→PART 2) |
(→PART 2) |
||
| Line 66: | Line 66: | ||
</pre> | </pre> | ||
| − | [[Image:plot for part 2_ECE301Fall2008mboutin|center]] | + | [[Image:plot for part 2_ECE301Fall2008mboutin.jpg|center]] |
Latest revision as of 18:26, 12 September 2008
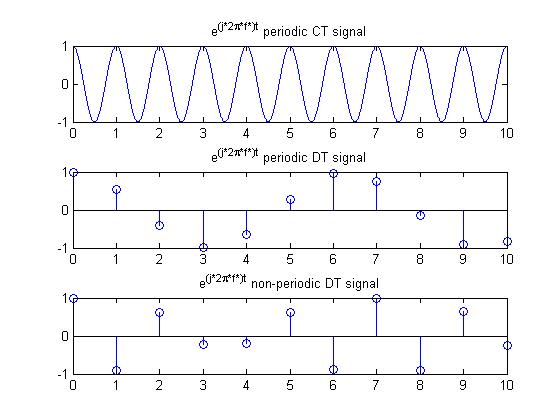
PERIODIC AND NON-PERIODIC DT SIGNALS FROM A CT SIGNAL
%ECE 301
%Daniel Barjum
%HW 2A

clear
clc

%periodic CT signal

f = 1;
t = 0:0.001:10;
x = real(exp(j*2*pi*f*t));
subplot(3,1,1);
plot(t,x)
title('e^{(j*2\pi*f*)t} periodic CT signal');

%periodic DT signal

f = 1/(2*pi);
n = 0:1:10;
x = real(exp(j*2*pi*f*n));
subplot(3,1,2);
stem(n,x)
title('e^{(j*2\pi*f*)t} periodic DT signal');

%non - periodic DT signal

f = pi/2;
n = 0:1:10;
x = real(exp(j*2*pi*f*n));
subplot(3,1,3);
stem(n,x)
title('e^{(j*2\pi*f*)t} non-periodic DT signal');
PART 2
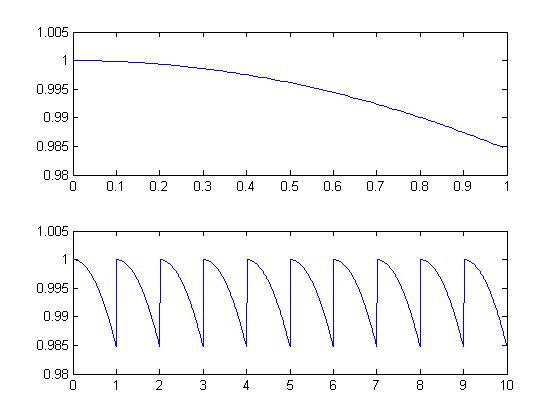
MAKING A NON PERIODIC SIGNAL PERIODIC
algorithm was borrowed from a friend.
clear
clc

t=0.0001:.01:1;
y=exp(3*t*j/17);
subplot(2,1,1);
plot(t,y)

x=[]
for lcv=1:10
    x=[x,y];
end

t=[0.01:.01:10];
subplot(2,1,2);
plot(t,x)


