(→Periodic signal revisited) |
|||
| Line 14: | Line 14: | ||
2. for making a periodic siganl | 2. for making a periodic siganl | ||
lets take an example of <math>X=\ e^t</math> | lets take an example of <math>X=\ e^t</math> | ||
| + | |||
the graph of the function is | the graph of the function is | ||
| + | |||
[[Image:nonperiodic12_ECE301Fall2008mboutin.jpg]] | [[Image:nonperiodic12_ECE301Fall2008mboutin.jpg]] | ||
| Line 35: | Line 37: | ||
the periodic function thus is | the periodic function thus is | ||
| + | |||
[[Image:periodic12_ECE301Fall2008mboutin.jpg]] | [[Image:periodic12_ECE301Fall2008mboutin.jpg]] | ||
Latest revision as of 18:18, 11 September 2008
Periodic signal revisited
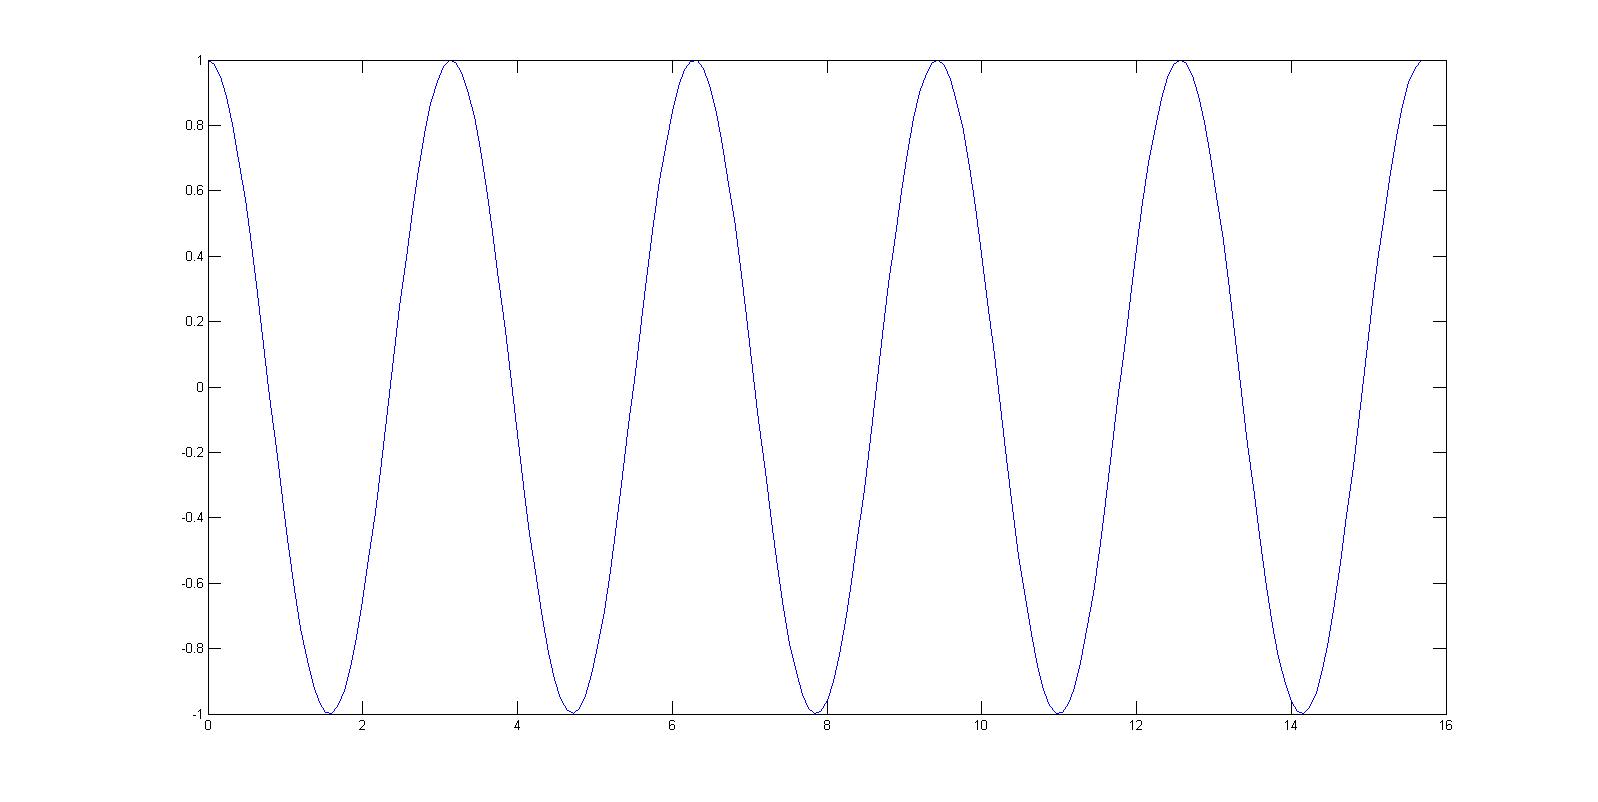
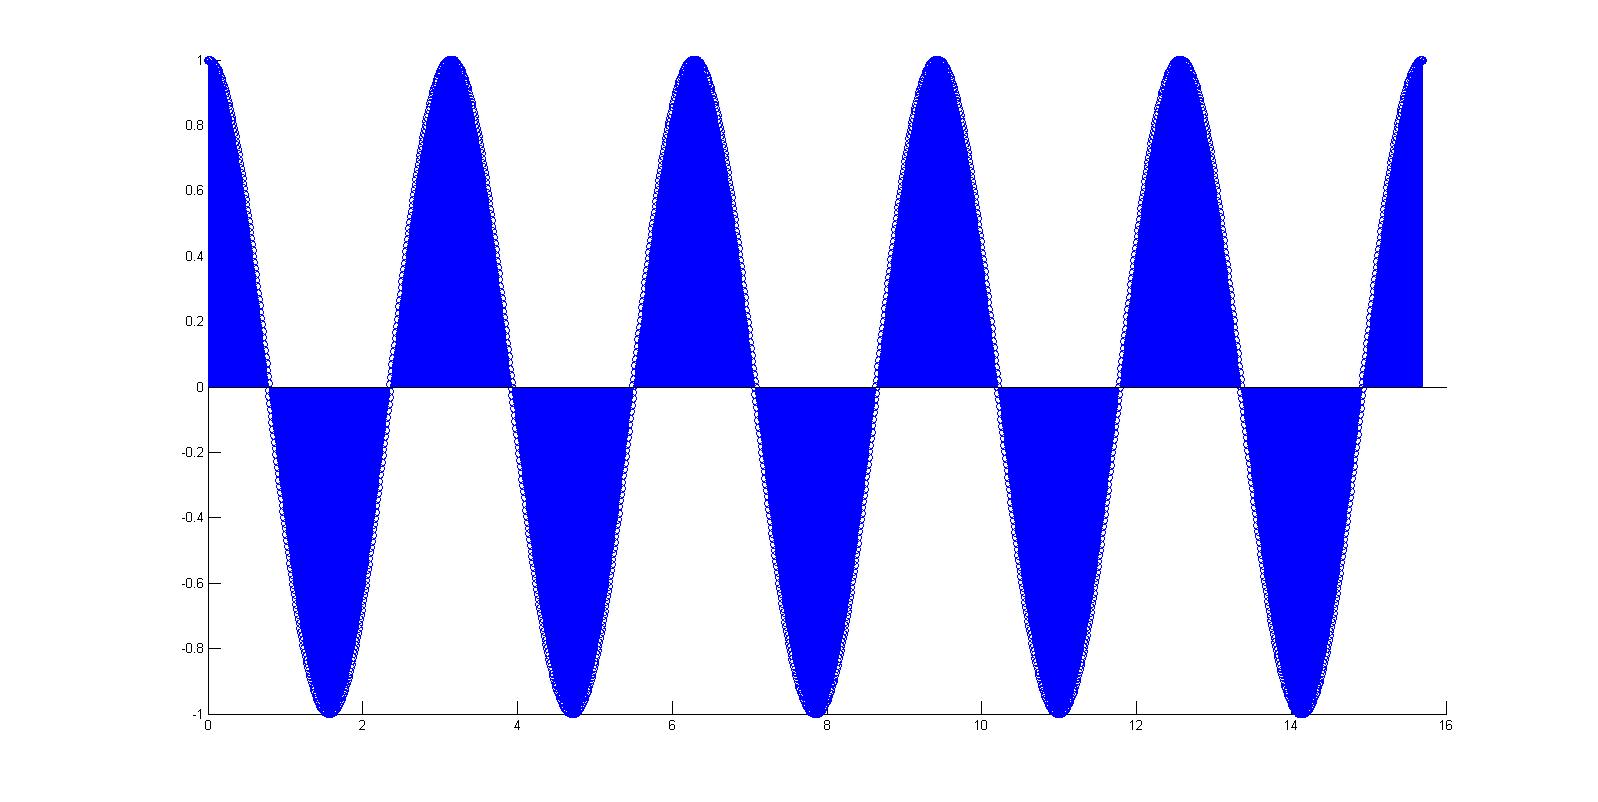
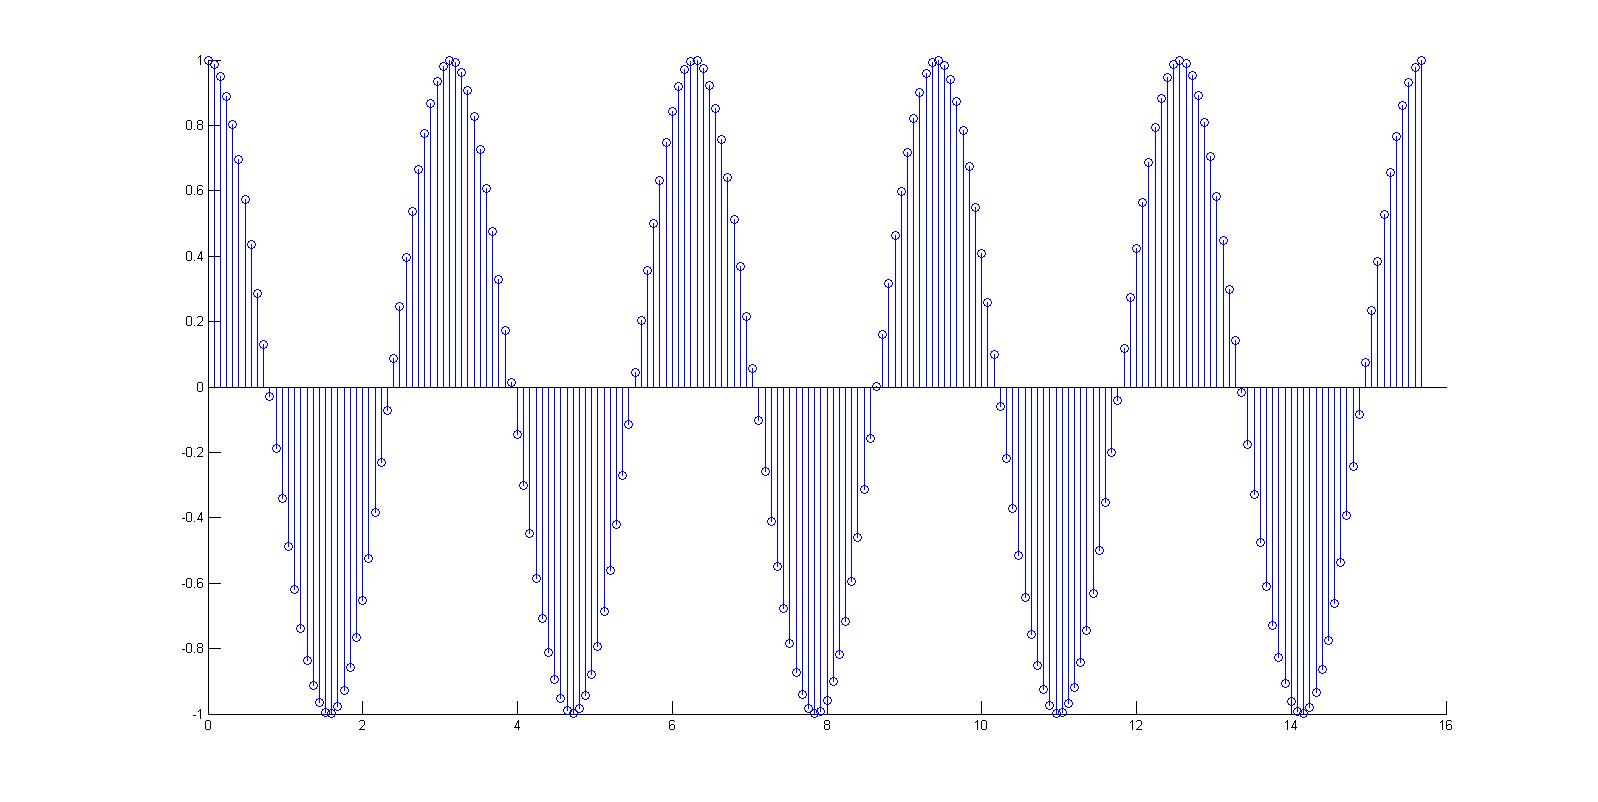
1. I am considering my example x=cos2t from 0 to 5pi used in the previous homework part 1.E.
sampled at 0.01
but converting it to DT and increasing the sampling rate to 0.08 shows a non-periodic set of points
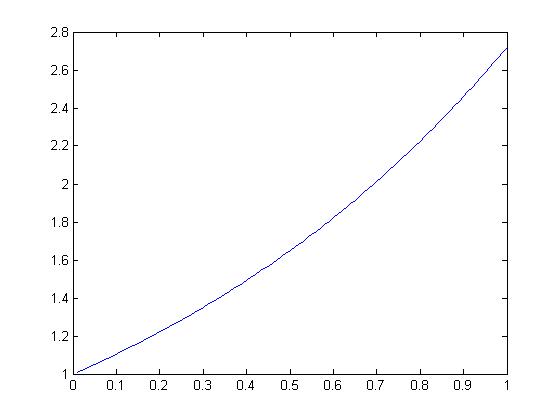
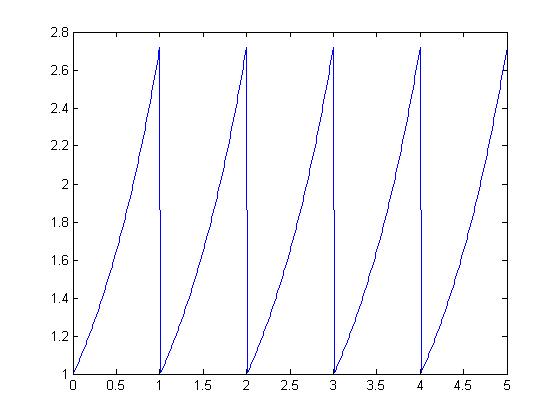
2. for making a periodic siganl lets take an example of $ X=\ e^t $
the graph of the function is
to convert it to periodic we use the following matlabcode
%referred the code of paul sceffler
clc
clear

t=.01:.01:1;
x=exp(t);
i=[];
for d=1:5
    i=[i,x];
end

t=[.01:.01:5];
plot(t,i)
the periodic function thus is

