(→Periodic Signals Revisited) |
(→Periodic Signals Revisited) |
||
| Line 6: | Line 6: | ||
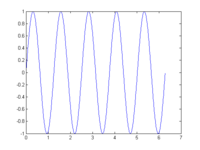
I chose to modify the signal a bit and make it y = sin(5t). | I chose to modify the signal a bit and make it y = sin(5t). | ||
| − | [[Image:sin5t_ECE301Fall2008mboutin.png|200px|left]] | + | [[Image:sin5t_ECE301Fall2008mboutin.png|200px|thumb|left]] |
| − | If you plot the signal in DT sampling at delta = .5Hz you get a periodic signal as follows: | + | :If you plot the signal in DT sampling at delta = .5Hz you get a periodic signal as follows: |
| − | [[Image:sin5tper_ECE301Fall2008mboutin.png|200px|left]] | + | [[Image:sin5tper_ECE301Fall2008mboutin.png|200px|thumb|left]] |
Revision as of 08:37, 11 September 2008
Periodic Signals Revisited
The function chosen (by randomly clicking a name) from hw1 is y=sin(t). Found here: http://cobweb.ecn.purdue.edu/~mboutin/ECE301/Index.html
I chose to modify the signal a bit and make it y = sin(5t).
- If you plot the signal in DT sampling at delta = .5Hz you get a periodic signal as follows:


