| Line 2: | Line 2: | ||
=Failure of the models= | =Failure of the models= | ||
| − | |||
| + | ===Example of using logistic models to fit U.S. population from 1725 to 1950=== | ||
| − | + | We have mentioned the fact that models are not perfectly fitting the population data we have, but by how much and how bad is the projection? In this section, we will be refereeing some real numerical data to support our claims. | |
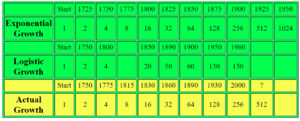
| + | Let’s started with the dataset we will use below, with the initial population in 1700 as 1 million. You can see side by side comparison about how exponential growth model and classic logistic growth model compares with the actual growth number. | ||
| + | |||
| + | [[File:Graph_6.1.png|300px]] | ||
| + | |||
| + | For all the data fitting in this section, we are using David A. Coutts’s article(2011), his sources is Benjamin Franklin's 1751 observation of the population of the USA, How Many People Can The Earth Support by Joel E. Cohen (1995) and "Atlas Of World Population History" by Colin McEvedy and Richard Jones. | ||
| + | |||
| + | For the exponential growth prediction, he assume that double the population needs a period of 25 years, which is equates to an average constant growth rate of 2.8% per annum. | ||
| + | |||
| + | For the Logistic Growth prediction, we assumed an upper asymptote (carrying capacity) of 197.27 million which is set by Pearl and Read (1920) | ||
| + | |||
| + | The Actual Growth of the population of the USA is based on figures from Colin McEvedy and Richard Jones. | ||
| + | |||
| + | [[File:Graph_6.2.png|300px]] | ||
| + | |||
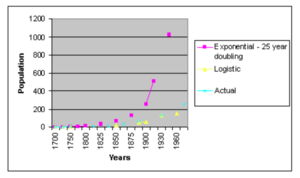
| + | From the graph, we can clearly see that the exponential growth models doesn’t fit the true data. While at the same time, even though it appears to have a closer fit to reality, the logistic model also fails in the prediction. | ||
[[ Walther MA279 Fall2018 topic10|Back to Walther MA279 Fall2018 topic10]] | [[ Walther MA279 Fall2018 topic10|Back to Walther MA279 Fall2018 topic10]] | ||
Revision as of 18:52, 2 December 2018
Failure of the models
Example of using logistic models to fit U.S. population from 1725 to 1950
We have mentioned the fact that models are not perfectly fitting the population data we have, but by how much and how bad is the projection? In this section, we will be refereeing some real numerical data to support our claims.
Let’s started with the dataset we will use below, with the initial population in 1700 as 1 million. You can see side by side comparison about how exponential growth model and classic logistic growth model compares with the actual growth number.
For all the data fitting in this section, we are using David A. Coutts’s article(2011), his sources is Benjamin Franklin's 1751 observation of the population of the USA, How Many People Can The Earth Support by Joel E. Cohen (1995) and "Atlas Of World Population History" by Colin McEvedy and Richard Jones.
For the exponential growth prediction, he assume that double the population needs a period of 25 years, which is equates to an average constant growth rate of 2.8% per annum.
For the Logistic Growth prediction, we assumed an upper asymptote (carrying capacity) of 197.27 million which is set by Pearl and Read (1920)
The Actual Growth of the population of the USA is based on figures from Colin McEvedy and Richard Jones.
From the graph, we can clearly see that the exponential growth models doesn’t fit the true data. While at the same time, even though it appears to have a closer fit to reality, the logistic model also fails in the prediction.


