| Line 7: | Line 7: | ||
[[Image:DOE1.jpg]][1] | [[Image:DOE1.jpg]][1] | ||
| + | <br> | ||
Which is then introduced into the first delta function as following: | Which is then introduced into the first delta function as following: | ||
<br> | <br> | ||
[[Image:DOE2.jpg]][1] | [[Image:DOE2.jpg]][1] | ||
| + | <br> | ||
And the end end up with what mathematicians called Dirac delta function: | And the end end up with what mathematicians called Dirac delta function: | ||
<br> | <br> | ||
[[Image:DOE3.jpg]] [1] | [[Image:DOE3.jpg]] [1] | ||
| + | <br> | ||
| + | [1] “Dirac delta function. Internet: http://en.wikipedia.org/wiki/Dirac_delta_function, March. | ||
| + | 8, 2013 [March. 10, 2013]. | ||
[[Category:Fourier series]] | [[Category:Fourier series]] | ||
<br> | <br> | ||
Revision as of 10:32, 11 March 2013
1.Impulse response<\n>
Joseph Fourier first represented Fourier integral theorem in the following DOE:
![]() [1]
[1]
Which is then introduced into the first delta function as following:
![]() [1]
[1]
And the end end up with what mathematicians called Dirac delta function:
 [1]
[1]
[1] “Dirac delta function. Internet: http://en.wikipedia.org/wiki/Dirac_delta_function, March.
8, 2013 [March. 10, 2013].
2.Fourier series
The input x(t) is a function with a fundamental period x(t)= 1 from x= 0 to 1 and f(x)= -1 to 0, with a discontinuity at x=0. The following graphs from matlab represents Gibbs phenomena, as n increases the overshot decreases.
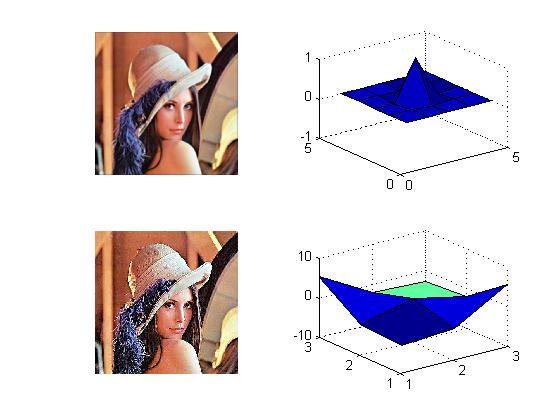
The upper is the Gaussian filter, while bottom is the unsharp.


