Line 13: Line 13:
 
----
 
----
  
Introduction & Background  
+
'''Introduction & Background'''
  
 
Generally, there are two criteria to determine image similarity, the coefficient of determination (R2) and the mean absolute error (MAE). Here in this project, I use the coefficient of determination for similarity analysis.  
 
Generally, there are two criteria to determine image similarity, the coefficient of determination (R2) and the mean absolute error (MAE). Here in this project, I use the coefficient of determination for similarity analysis.  
Line 23: Line 23:
 
&nbsp;&nbsp; &nbsp; &nbsp; &nbsp; &nbsp;or &nbsp; &nbsp; &nbsp; &nbsp; &nbsp;<math>R2 = \frac{SS_{xy}^2}{SS_{xx} SS_{yy} }</math>&nbsp;&nbsp; &nbsp; &nbsp; &nbsp; &nbsp; &nbsp; &nbsp; &nbsp; &nbsp; &nbsp; &nbsp; &nbsp; &nbsp; &nbsp; &nbsp; &nbsp; &nbsp; &nbsp; &nbsp; &nbsp; &nbsp; &nbsp; &nbsp; &nbsp; &nbsp; &nbsp; &nbsp; &nbsp; &nbsp; &nbsp; &nbsp; &nbsp; &nbsp; &nbsp; &nbsp; &nbsp; ( 2 )  
 
&nbsp;&nbsp; &nbsp; &nbsp; &nbsp; &nbsp;or &nbsp; &nbsp; &nbsp; &nbsp; &nbsp;<math>R2 = \frac{SS_{xy}^2}{SS_{xx} SS_{yy} }</math>&nbsp;&nbsp; &nbsp; &nbsp; &nbsp; &nbsp; &nbsp; &nbsp; &nbsp; &nbsp; &nbsp; &nbsp; &nbsp; &nbsp; &nbsp; &nbsp; &nbsp; &nbsp; &nbsp; &nbsp; &nbsp; &nbsp; &nbsp; &nbsp; &nbsp; &nbsp; &nbsp; &nbsp; &nbsp; &nbsp; &nbsp; &nbsp; &nbsp; &nbsp; &nbsp; &nbsp; &nbsp; ( 2 )  
  
&nbsp;&nbsp; &nbsp; &nbsp; with &nbsp; &nbsp; &nbsp; &nbsp; &nbsp;<math>SS_{xy} = \sum_{i=1}^N (y_i - y_{avg})(x_i - x_{avg})</math>&nbsp;&nbsp; &nbsp; &nbsp; &nbsp; &nbsp; &nbsp; &nbsp; &nbsp; &nbsp; &nbsp; &nbsp; &nbsp; &nbsp; &nbsp; &nbsp; &nbsp; &nbsp;( 3 ) &nbsp;&nbsp; &nbsp; &nbsp;
+
&nbsp;&nbsp; &nbsp; &nbsp; where &nbsp; &nbsp; &nbsp;&nbsp;<math>SS_{xy} = \sum_{i=1}^N (y_i - y_{avg})(x_i - x_{avg})</math>&nbsp;&nbsp; &nbsp; &nbsp; &nbsp; &nbsp; &nbsp; &nbsp; &nbsp; &nbsp; &nbsp; &nbsp; &nbsp; &nbsp; &nbsp; &nbsp; &nbsp; &nbsp;( 3 ) &nbsp;&nbsp; &nbsp; &nbsp;  
  
&nbsp;&nbsp; &nbsp; &nbsp; &nbsp; &nbsp; &nbsp; &nbsp; &nbsp; &nbsp; &nbsp; &nbsp;&nbsp;<math>SS_{yy} = \sum_{i=1}^N (y_i - y_{avg})^2</math>&nbsp;&nbsp; &nbsp; &nbsp; &nbsp; &nbsp; &nbsp; &nbsp; &nbsp; &nbsp; &nbsp; &nbsp; &nbsp; &nbsp; &nbsp; &nbsp; &nbsp; &nbsp; &nbsp; &nbsp; &nbsp; &nbsp; &nbsp; &nbsp; &nbsp; &nbsp; &nbsp; &nbsp; &nbsp; &nbsp; ( 4 )
+
&nbsp;&nbsp; &nbsp; &nbsp; &nbsp; &nbsp; &nbsp; &nbsp; &nbsp; &nbsp; &nbsp; &nbsp;&nbsp;<math>SS_{yy} = \sum_{i=1}^N (y_i - y_{avg})^2</math>&nbsp;&nbsp; &nbsp; &nbsp; &nbsp; &nbsp; &nbsp; &nbsp; &nbsp; &nbsp; &nbsp; &nbsp; &nbsp; &nbsp; &nbsp; &nbsp; &nbsp; &nbsp; &nbsp; &nbsp; &nbsp; &nbsp; &nbsp; &nbsp; &nbsp; &nbsp; &nbsp; &nbsp; &nbsp; &nbsp; ( 4 )  
  
&nbsp;&nbsp; &nbsp; &nbsp; &nbsp; &nbsp; &nbsp; &nbsp; &nbsp; &nbsp; &nbsp; &nbsp;&nbsp;<math>SS_{xx} = \sum_{i=1}^N (x_i - x_{avg})^2</math>&nbsp;&nbsp; &nbsp; &nbsp; &nbsp; &nbsp; &nbsp; &nbsp; &nbsp; &nbsp; &nbsp; &nbsp; &nbsp; &nbsp; &nbsp; &nbsp; &nbsp; &nbsp; &nbsp; &nbsp; &nbsp; &nbsp; &nbsp; &nbsp; &nbsp; &nbsp; &nbsp; &nbsp; &nbsp; &nbsp;( 5 )
+
&nbsp;&nbsp; &nbsp; &nbsp; &nbsp; &nbsp; &nbsp; &nbsp; &nbsp; &nbsp; &nbsp; &nbsp;&nbsp;<math>SS_{xx} = \sum_{i=1}^N (x_i - x_{avg})^2</math>&nbsp;&nbsp; &nbsp; &nbsp; &nbsp; &nbsp; &nbsp; &nbsp; &nbsp; &nbsp; &nbsp; &nbsp; &nbsp; &nbsp; &nbsp; &nbsp; &nbsp; &nbsp; &nbsp; &nbsp; &nbsp; &nbsp; &nbsp; &nbsp; &nbsp; &nbsp; &nbsp; &nbsp; &nbsp; &nbsp;( 5 )  
 +
 
 +
Where N is the total number of the components. x is the value of reference image, y is the value of the other image. x<sub>avg</sub>&nbsp;is the mean of the x values and y<sub>avg</sub> is the mean of the y values.
 +
 
 +
The meaning of R2:&nbsp;R2 value varies from 0 to 1. 1 means perfect fit between models, 0 means very poor fit; a good fit if R2 &gt;0.8, and poor fit if R2&lt;0.3.
  
 
<br> <br>  
 
<br> <br>  

Revision as of 05:54, 6 December 2011


Similarity analysis of images

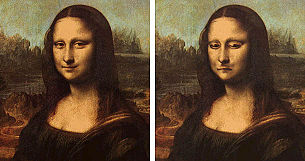
Mona2.jpg

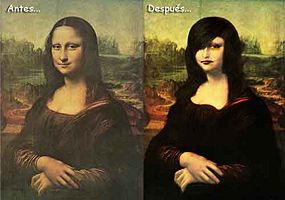
Look at the Mona Lisa(s) above. They are very similar, aren't they? It's obvious, and you can say that they have high similarity. But given the pictures below, how to determine the similarity? Let's see!

Emo mona lisa.jpg


Introduction & Background

Generally, there are two criteria to determine image similarity, the coefficient of determination (R2) and the mean absolute error (MAE). Here in this project, I use the coefficient of determination for similarity analysis.

The computation of R2 is:

                       $ R2 = 1 - {\sum_{i=1}^N (y_i - y_{pre})^2 / \sum_{i=1}^N (y_i - y_{avg})^2 } $              ( 1 )

          or          $ R2 = \frac{SS_{xy}^2}{SS_{xx} SS_{yy} } $                                                                         ( 2 )

       where       $ SS_{xy} = \sum_{i=1}^N (y_i - y_{avg})(x_i - x_{avg}) $                                  ( 3 )       

                       $ SS_{yy} = \sum_{i=1}^N (y_i - y_{avg})^2 $                                                           ( 4 )

                       $ SS_{xx} = \sum_{i=1}^N (x_i - x_{avg})^2 $                                                          ( 5 )

Where N is the total number of the components. x is the value of reference image, y is the value of the other image. xavg is the mean of the x values and yavg is the mean of the y values.

The meaning of R2: R2 value varies from 0 to 1. 1 means perfect fit between models, 0 means very poor fit; a good fit if R2 >0.8, and poor fit if R2<0.3.


                                                 ...to be continued


Back to 2011 Fall ECE 438 Boutin

Alumni Liaison

Questions/answers with a recent ECE grad

Ryne Rayburn