| Line 3: | Line 3: | ||
Q1. | Q1. | ||
| − | [[Image:MCode_HW6_Q1]] | + | [[Image:MCode_HW6_Q1.jpg]] |
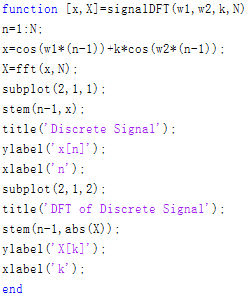
Assign the value of parameters and then call the function signalDFT | Assign the value of parameters and then call the function signalDFT | ||
| Line 22: | Line 22: | ||
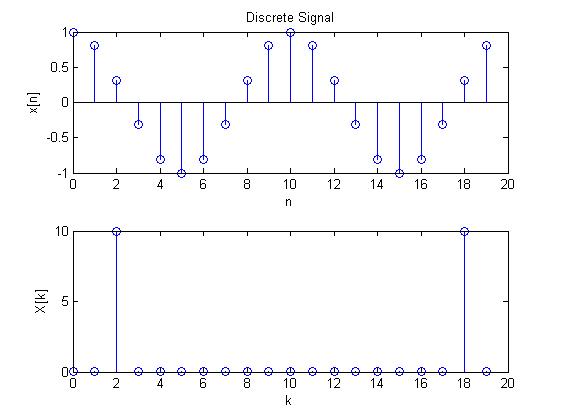
case 1: | case 1: | ||
| − | [[Image:HW6_Q1_Case1]] | + | [[Image:HW6_Q1_Case1.jpg]] |
case 2: | case 2: | ||
Revision as of 01:44, 19 October 2010
Homework 6 Solution
Q1.
Assign the value of parameters and then call the function signalDFT
For example, in case 6 type following command in the command window of Matlab:
N=20;
w1=0.62831853;
k=0.2;
w2=0.79168135;
[x,X]=signal(w1,w2,k,N);
Plot result:
case 2: File:HW6 Q1 Case2
case 3: File:HW6 Q1 Case3
case 4: File:HW6 Q1 Case4
case 5: File:HW6 Q1 Case5
case 6: File:HW6 Q1 Case6
Q2.
Q3.
Q4.
Q5.
Q6.
Q7.


