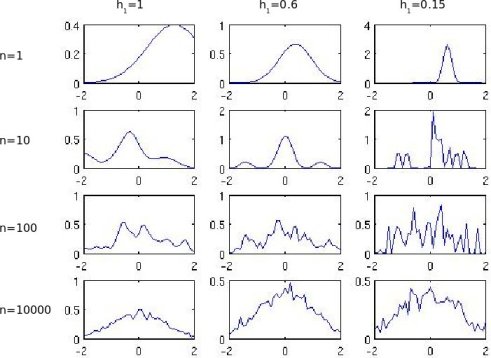
(New page: '''PLEASE HELP FIX MATLAB CODE''' I have tried replicating the results of figure 4.5 on page 169 of DHS. It shows Parzen-window estimates of a univariate gaussian density using different ...) |
|||
| Line 9: | Line 9: | ||
Here's the MATLAB code. It will be great if somebody can take a look at the code and try to match the results with the book.:: | Here's the MATLAB code. It will be great if somebody can take a look at the code and try to match the results with the book.:: | ||
| − | < | + | <code style="matlab"> |
% This code replicates the results of figure 4.5 on page 169 of DHS | % This code replicates the results of figure 4.5 on page 169 of DHS | ||
| Line 46: | Line 46: | ||
end | end | ||
end | end | ||
| − | </ | + | </code> |
Revision as of 19:43, 26 March 2008
PLEASE HELP FIX MATLAB CODE
I have tried replicating the results of figure 4.5 on page 169 of DHS. It shows Parzen-window estimates of a univariate gaussian density using different window widths and number of samples.
Here's the figure that I got from my MATLAB code. As you can see, my results do not match well with the figure of the book....especially for n=10, 100, 10000. I tried looking at the code for considerable amount of time but could not figure out what is wrong.
Here's the MATLAB code. It will be great if somebody can take a look at the code and try to match the results with the book.::
% This code replicates the results of figure 4.5 on page 169 of DHS
close all; clear;
h1 = [1 0.6 0.15]; % this parameter controls the window width h_n n = [1 10 100 1e4]; % total number of samples d = 1; % number of dimensions
x = [-2:0.1:2]; % data points at which density will be estimated using parzen window method len_x = length(x);
figure; hold on;
for row = 1:length(n)
for col = 1:length(h1)
disp(['n = ' num2str(n(row)) ' h1 = ' num2str(h1(col))]);
   hn = h1(col)/sqrt(n(row));  % look on page 168, DHS: h_n = h_1 / sqrt(n)
   Vn = hn^d;
samples = random('normal',0,1,n(row),1);
prob_estimate = zeros(1,len_x);
   for i = 1:len_x
     sum1=0;
     for j = 1:n(row)
       sum1 = sum1 + (1/sqrt(2*pi))*exp(-0.5*((x(i)-samples(j))/hn)^2)/hn;
     end
     prob_estimate(i) = sum1/n(row);
   end
   subplot(length(n), length(h1), (row-1)*length(h1)+col); plot(x,prob_estimate);
 end
end


