| Line 13: | Line 13: | ||
and: | and: | ||
| − | <math> | + | <math>x[0] = 0</math> |
| − | + | ||
| − | + | <math>x[1] = 1</math> | |
| − | + | ||
| − | + | <math>x[2] = 2</math> | |
| + | |||
| + | <math>x[3] = 1</math> | ||
| + | |||
| + | <math>x[4] = 0</math> | ||
Therefore: | Therefore: | ||
<math>a_{0} = \frac{1}{4} \sum_{n=0}^{3} x[n]</math> | <math>a_{0} = \frac{1}{4} \sum_{n=0}^{3} x[n]</math> | ||
Revision as of 16:49, 23 September 2008
Periodic DT Signal
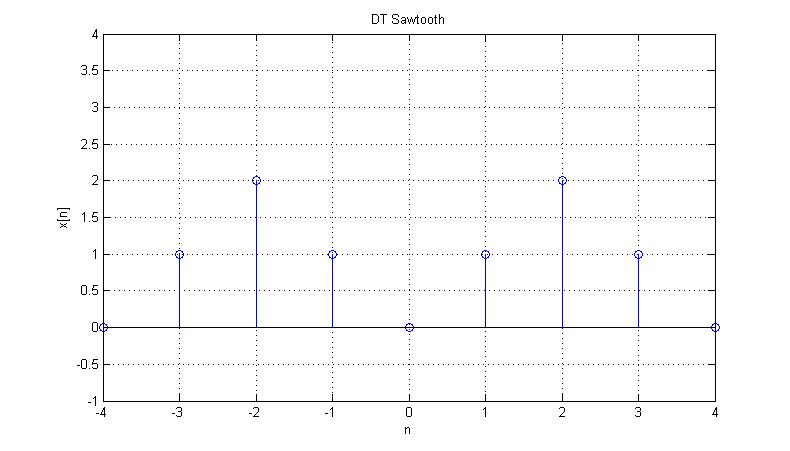
The following plot shows two periods of the periodic DT signal $ x[n] $, a sawtooth:
Fourier Series Coefficients
$ a_{k} = \frac{1}{N} \sum_{n=0}^{N-1} x[n] e^{-jk \frac{2 \pi}{N} n} $
From the plot above, N = 4:
$ a_{k} = \frac{1}{4} \sum_{n=0}^{3} x[n] e^{-jk \frac{\pi}{2} n} $
and:
$ x[0] = 0 $
$ x[1] = 1 $
$ x[2] = 2 $
$ x[3] = 1 $
$ x[4] = 0 $
Therefore:
$ a_{0} = \frac{1}{4} \sum_{n=0}^{3} x[n] $


