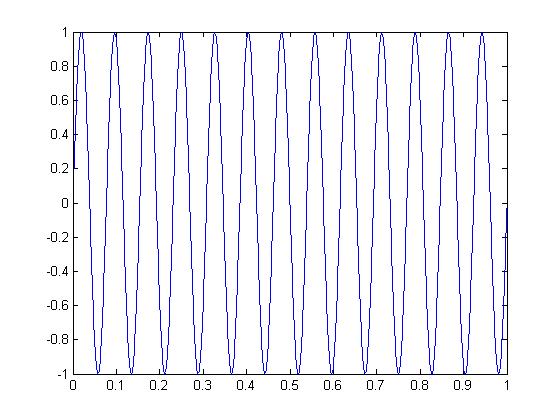
(New page: The bug in the MATLAB program is that the sampling frequency here is uite large, as a result it is not getting enough points in order to plot a proper garph. When this sampling freuency is...) |
|||
| Line 1: | Line 1: | ||
The bug in the MATLAB program is that the sampling frequency here is uite large, as a result it is not getting enough points in order to plot a proper garph. | The bug in the MATLAB program is that the sampling frequency here is uite large, as a result it is not getting enough points in order to plot a proper garph. | ||
When this sampling freuency is reduced then the graph comes out to be | When this sampling freuency is reduced then the graph comes out to be | ||
| + | |||
| + | [[Image:figure3_ECE301Fall2008mboutin.jpg]] | ||
Revision as of 13:43, 12 September 2008
The bug in the MATLAB program is that the sampling frequency here is uite large, as a result it is not getting enough points in order to plot a proper garph. When this sampling freuency is reduced then the graph comes out to be


