(→LINKS) |
(→LINKS) |
||
| Line 2: | Line 2: | ||
== LINKS == | == LINKS == | ||
| − | Daniel Barjum | + | Daniel Barjum |
| + | A [http://cobweb.ecn.purdue.edu/~mboutin/ECE301/Index.html] | ||
| + | [B] [C] [D] [E] | ||
== MATLAB CODE == | == MATLAB CODE == | ||
Revision as of 09:38, 12 September 2008
LINKS
Daniel Barjum A [1] [B] [C] [D] [E]
MATLAB CODE
%ECE 301
%Daniel Barjum
%HW 2B - Find the Bug

clear
clc

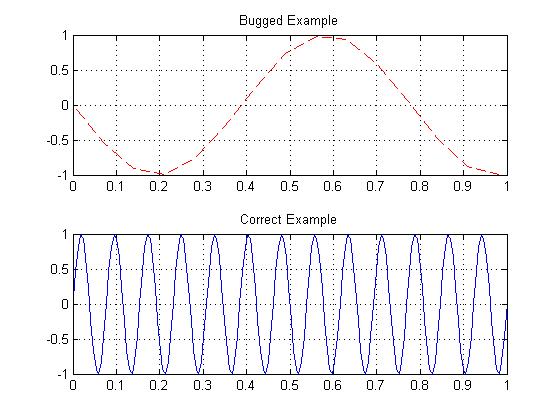
%The following code attempts to plot 13 cycles of
%a 13 Hz sinusoid, but it has a bug!


F0 = 13;
T0 = 1/F0;
Ts = 0.07;
t  = 0:Ts:13*T0;
x = real(exp(j*(2*pi*F0*t-pi/2)));
subplot(2,1,1)
plot(t,x,'--r')
grid
title('Bugged Example');

%It does not plot 13 cycles of the wave!
%it only plots a little over one cycle.

%to make it plot thirteen cycles
%make the Ts value small enough
%i.e. 13 times smaller than T0.

F0 = 13;
T0 = 1/F0;
Ts = T0 / 13;
t  = 0:Ts:13*T0;
x = real(exp(j*(2*pi*F0*t-pi/2)));
subplot(2,1,2)
plot(t,x)
grid
title('Correct Example');


