| Line 1: | Line 1: | ||
==Periodic signal revisited== | ==Periodic signal revisited== | ||
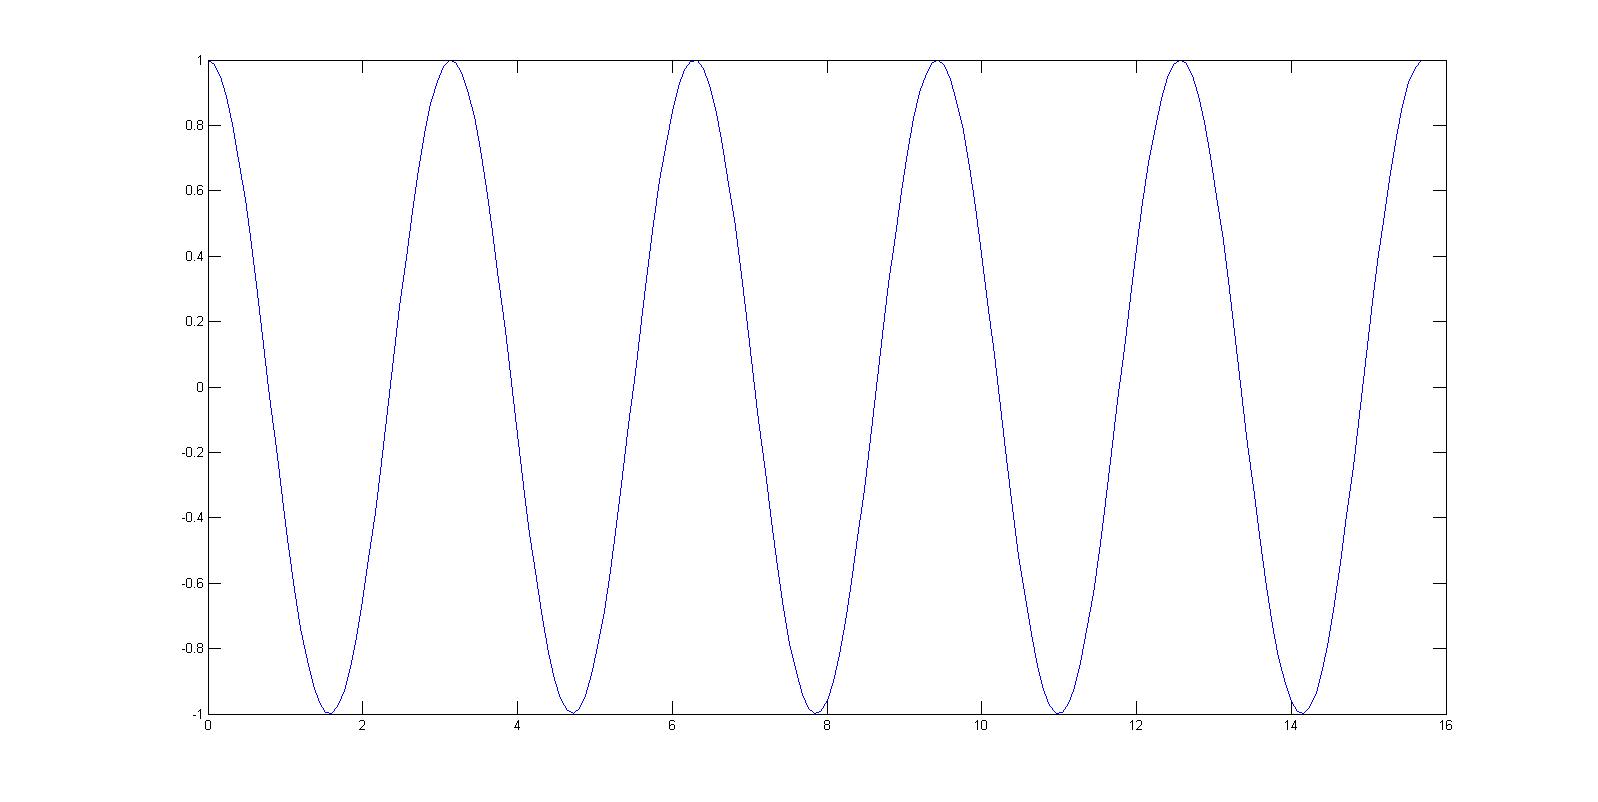
| − | 1. I am considering my example x=cos2t from 0 to 5pi used in the previous homework part 1.E. | + | 1. I am considering my example x=cos2t from 0 to 5pi used in the previous homework part 1.E. |
| + | |||
| + | [[Image:ct_ECE301Fall2008mboutin.jpg]] | ||
| + | |||
| + | |||
| + | |||
| + | |||
| + | |||
| + | |||
| + | |||
| + | sampled at 0.01 | ||
| + | |||
| + | |||
| + | |||
| + | |||
| + | |||
| + | |||
| + | |||
| + | |||
| + | |||
| + | |||
but converting it to DT and increasing the sampling rate to 0.08 shows a non-periodic set of points | but converting it to DT and increasing the sampling rate to 0.08 shows a non-periodic set of points | ||
Revision as of 16:28, 11 September 2008
Periodic signal revisited
1. I am considering my example x=cos2t from 0 to 5pi used in the previous homework part 1.E.
sampled at 0.01
but converting it to DT and increasing the sampling rate to 0.08 shows a non-periodic set of points


