| (One intermediate revision by the same user not shown) | |||
| Line 1: | Line 1: | ||
I think The bug is Ts is too big. so I decreased Ts(divided by 100000) value to get accurate graph. | I think The bug is Ts is too big. so I decreased Ts(divided by 100000) value to get accurate graph. | ||
| + | |||
| + | F0 =13; | ||
| + | |||
| + | T0 =1/F0; | ||
| + | |||
| + | Ts = 0.07/100000; | ||
| + | |||
| + | t = 0:Ts:13*T0; | ||
| + | |||
| + | x = real(exp(j*(2*pi*F0*t-pi/2))); | ||
| + | |||
| + | plot(t,x) | ||
| + | |||
| + | [[Image:Jj_ECE301Fall2008mboutin.jpg]] | ||
Latest revision as of 17:02, 10 September 2008
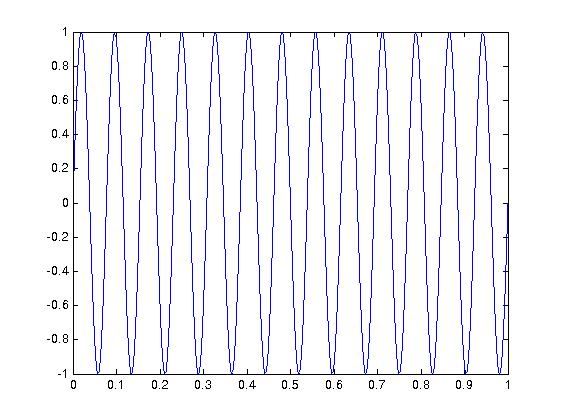
I think The bug is Ts is too big. so I decreased Ts(divided by 100000) value to get accurate graph.
F0 =13;
T0 =1/F0;
Ts = 0.07/100000;
t = 0:Ts:13*T0;
x = real(exp(j*(2*pi*F0*t-pi/2)));
plot(t,x)


