| (One intermediate revision by the same user not shown) | |||
| Line 5: | Line 5: | ||
However, using a tree diagram also has its limitations: if we want to calculate the probability after a month or even half a year, the tree diagram method will no longer be efficient. Therefore, mathematicians adopted the calculation method using Matrix. The matrix below is called the “transition probability matrix”. | However, using a tree diagram also has its limitations: if we want to calculate the probability after a month or even half a year, the tree diagram method will no longer be efficient. Therefore, mathematicians adopted the calculation method using Matrix. The matrix below is called the “transition probability matrix”. | ||
| − | <math>\left(\begin{array}{cccc}P_{11}&P_{12}&...&P_{1n}\\P_{21}&P_{22}&...&P_{2n}\\...&...&...&...\\P_{m1}&P_{m2}&...&P_{mn}\end{array}\right)</math> | + | <center><math>\left(\begin{array}{cccc}P_{11}&P_{12}&...&P_{1n}\\P_{21}&P_{22}&...&P_{2n}\\...&...&...&...\\P_{m1}&P_{m2}&...&P_{mn}\end{array}\right)</math></center> |
| − | Just as its name implies, each element inside the transition probability matrix describes a transition probability from state to another. Here, <math>P_{11}</math>represents the probability of event 1 occurring again on the second day after event 1 occurred on the first day; <math>P_{21}</math> represents the probability of event 1 occurring on the second day after event 2 occurred on the first day… and so on and so forth. Using this method, the transition probability matrix of the weather example can be written as: | + | Just as its name implies, each element inside the transition probability matrix describes a transition probability from state to another. Here, <math>P_{11}</math> represents the probability of event 1 occurring again on the second day after event 1 occurred on the first day; <math>P_{21}</math> represents the probability of event 1 occurring on the second day after event 2 occurred on the first day… and so on and so forth. Using this method, the transition probability matrix of the weather example can be written as: |
| − | <center>[[File:Markovmatrix.jpg| | + | <center>[[File:Markovmatrix.jpg|200px|thumbnail|center]]</center> |
| + | The rows represent the current state, and the columns represent the future state. To read this matrix, one would notice that <math>P_{11}</math>, <math>P_{21}</math>, and <math>P_{31}</math> are all transition probabilities of the current state of a rainy day. This is also the case for column two with the current state of a sunny day, and column three with the current state of a cloudy day. Notice how the sum of each column and row add up to one, confirming that they are valid probabilities. | ||
| + | State Vectors | ||
| + | A state vector is a column vector whose <math>i</math>th component is the probability that the system is in the <math>i</math>th state at that time. In the context of our example problem, if the current day has rainy weather, the state vector for the current day would be <math>\left(\begin{array}{ccc}1&0&0\end{array}\right)</math>, where the value of the first row signifies that there is a one hundred percent chance for the current day to have rainy weather. | ||
| + | |||
| + | [[ Walther MA271 Fall2020 topic2|Back to Markov Chains]] | ||
[[Category:MA271Fall2020Walther]] | [[Category:MA271Fall2020Walther]] | ||
Latest revision as of 23:40, 5 December 2020
Transition Probability Matrix
However, using a tree diagram also has its limitations: if we want to calculate the probability after a month or even half a year, the tree diagram method will no longer be efficient. Therefore, mathematicians adopted the calculation method using Matrix. The matrix below is called the “transition probability matrix”.
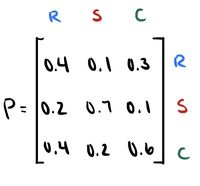
Just as its name implies, each element inside the transition probability matrix describes a transition probability from state to another. Here, $ P_{11} $ represents the probability of event 1 occurring again on the second day after event 1 occurred on the first day; $ P_{21} $ represents the probability of event 1 occurring on the second day after event 2 occurred on the first day… and so on and so forth. Using this method, the transition probability matrix of the weather example can be written as:
The rows represent the current state, and the columns represent the future state. To read this matrix, one would notice that $ P_{11} $, $ P_{21} $, and $ P_{31} $ are all transition probabilities of the current state of a rainy day. This is also the case for column two with the current state of a sunny day, and column three with the current state of a cloudy day. Notice how the sum of each column and row add up to one, confirming that they are valid probabilities.
State Vectors A state vector is a column vector whose $ i $th component is the probability that the system is in the $ i $th state at that time. In the context of our example problem, if the current day has rainy weather, the state vector for the current day would be $ \left(\begin{array}{ccc}1&0&0\end{array}\right) $, where the value of the first row signifies that there is a one hundred percent chance for the current day to have rainy weather.


