(Created page with " Time dependent changes- 1. Time delay- In simple terms you are shifting the original signal by a factor. For eg. <gallery> File:Time shift.jpg|Time shift made simpler </gallery>") |
|||
| (13 intermediate revisions by the same user not shown) | |||
| Line 1: | Line 1: | ||
Time dependent changes- | Time dependent changes- | ||
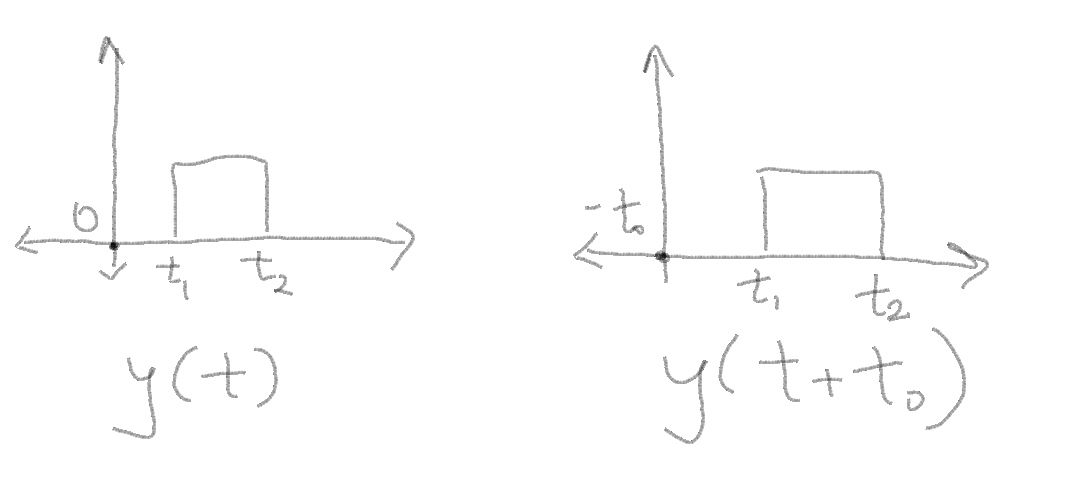
| − | 1. Time delay- In simple terms you are shifting the original signal by a factor. For eg. | + | 1. Time delay- <br /> |
| − | < | + | In simple terms you are shifting the original signal by a factor. |
| − | File: | + | For eg. |
| − | </ | + | [[File:Graph1.1.PNG|Time shift example]]<br /> |
| + | In this example as you can see, a simple way of understanding time shift/delay is by looking at how the graph changes when you want a shift in the signal. | ||
| + | |||
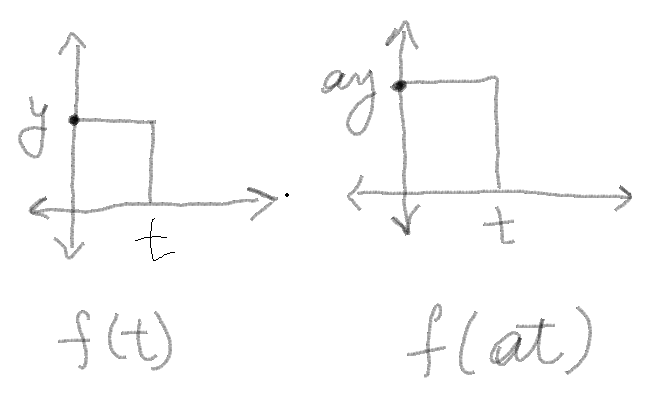
| + | 2. Time scaling- <br /> | ||
| + | |||
| + | [[File:Graph1.2.PNG|amplitude scaling graph example]]<br /> | ||
| + | In simple terms you are shifting the height/width of the graph of a signal. The change in graph depends on the value of a. If |a|>0, then the height increases, else it decreases. | ||
| + | |||
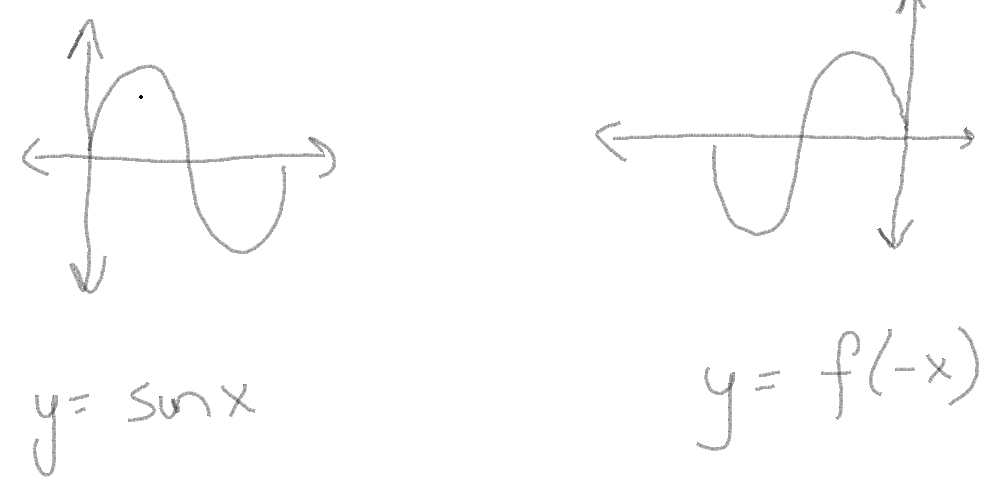
| + | 3. Time reversal-<br /> | ||
| + | [[File:Graph1.3.PNG|time reversal]]<br /> | ||
| + | When you negate the independent variable, the graph of the dependent variable changes to a mirror image of the original graph. | ||
| + | |||
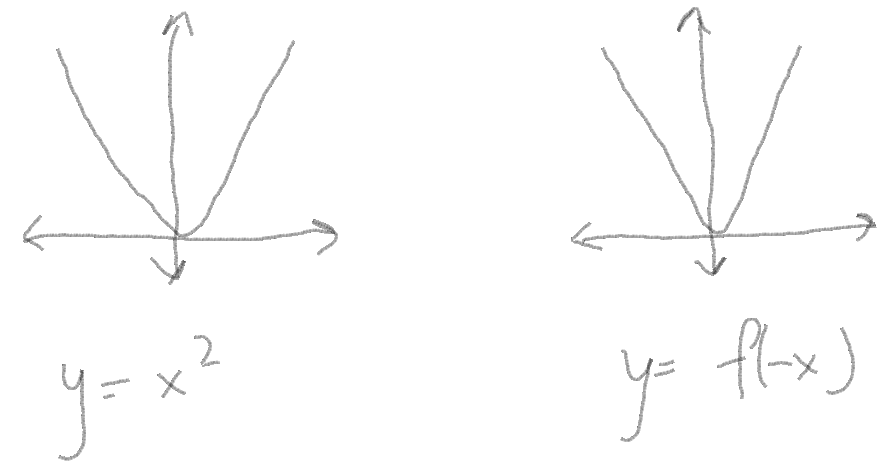
| + | Even/Odd Signals-<br /> | ||
| + | [[File:Graph1.4.PNG]]<br /> | ||
| + | |||
| + | As can be seen in the above function, the graphs do not change when you substitute x as -x. Similarly in signals, when a signal remains unchanged under time negation, it is termed as an "even" signal. | ||
| + | |||
| + | [[File:Graph1.5.PNG]] <br /> | ||
| + | |||
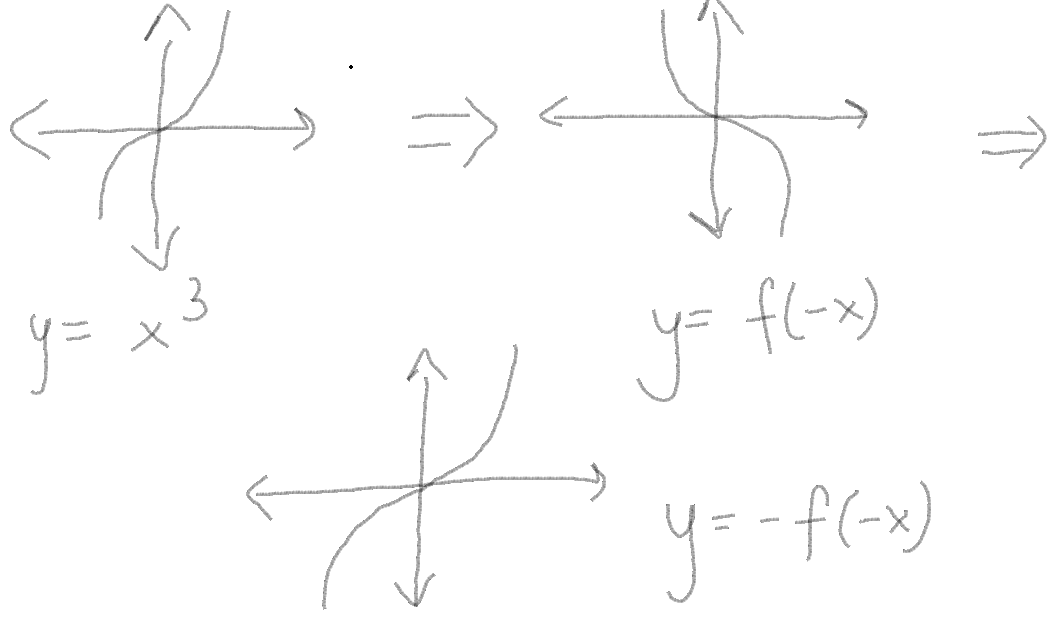
| + | As you can see in the above example, it shows step by step how the graph changes. When you see this type of behavior in the signal, it is said to be an "odd" signal. | ||
Latest revision as of 20:32, 1 December 2018
Time dependent changes-
1. Time delay-
In simple terms you are shifting the original signal by a factor.
For eg.
In this example as you can see, a simple way of understanding time shift/delay is by looking at how the graph changes when you want a shift in the signal.
2. Time scaling-
In simple terms you are shifting the height/width of the graph of a signal. The change in graph depends on the value of a. If |a|>0, then the height increases, else it decreases.
3. Time reversal-
When you negate the independent variable, the graph of the dependent variable changes to a mirror image of the original graph.
As can be seen in the above function, the graphs do not change when you substitute x as -x. Similarly in signals, when a signal remains unchanged under time negation, it is termed as an "even" signal.
As you can see in the above example, it shows step by step how the graph changes. When you see this type of behavior in the signal, it is said to be an "odd" signal.

