| (3 intermediate revisions by the same user not shown) | |||
| Line 9: | Line 9: | ||
:Standard Deviation: 19.9 | :Standard Deviation: 19.9 | ||
| − | [[Image:midterm1histECE438F10.png]] | + | <span style="color:green"> Grade Lines: </span> |
| + | ::<span style="color:green"> A >99 </span> | ||
| + | ::<span style="color:green"> B >64 </span> | ||
| + | ::<span style="color:green"> C >44 </span> | ||
| + | ::<span style="color:green"> Anything below 25 is highly problematic... </span> | ||
| + | Note that the grade lines were drawn in accordance with the grading scheme used. As the grading was very strict, the thresholds for each letter grades are accordingly set very low. -pm | ||
| + | |||
| + | [[Image:midterm1histECE438F10.png|500px]] | ||
---- | ---- | ||
[[2010_Fall_ECE_438_Boutin|Back to ECE438 Fall 2010, Prof. Boutin]] | [[2010_Fall_ECE_438_Boutin|Back to ECE438 Fall 2010, Prof. Boutin]] | ||
Latest revision as of 04:01, 15 October 2010
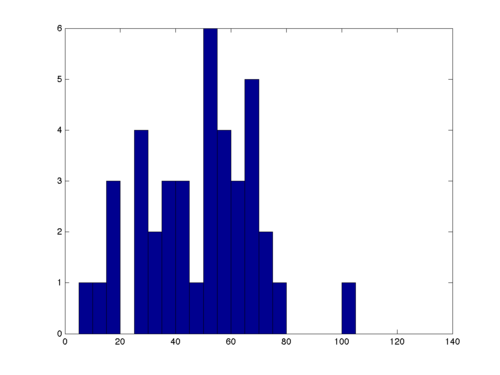
Midterm 1 Statistics
Digital Signal Processing (ECE438) Fall 2010, Prof. Boutin
- Total Number of Points: 120
- Max 101
- Min 9
- Mean 48.7
- Median 52
- Standard Deviation: 19.9
Grade Lines:
- A >99
- B >64
- C >44
- Anything below 25 is highly problematic...
Note that the grade lines were drawn in accordance with the grading scheme used. As the grading was very strict, the thresholds for each letter grades are accordingly set very low. -pm


