(→Introduction) |
(→Introduction) |
||
| Line 6: | Line 6: | ||
<center>[[Image:clustering_Old Kiwi.gif]] | <center>[[Image:clustering_Old Kiwi.gif]] | ||
| − | + | '''Figure 1: Simple Clustering Example''' </center> | |
For the data shown in Figure 1, we can easily identify the four clusters. The criteria used to separate the data is distance, which means that two or more objects will be associated with the same cluster if they are determined to be "close". This method is known as "distance-based clustering". (The alternative method is "conceptual clustering", through which objects are grouped according to descriptive/abstract attributes, as opposed to similarity measures.) | For the data shown in Figure 1, we can easily identify the four clusters. The criteria used to separate the data is distance, which means that two or more objects will be associated with the same cluster if they are determined to be "close". This method is known as "distance-based clustering". (The alternative method is "conceptual clustering", through which objects are grouped according to descriptive/abstract attributes, as opposed to similarity measures.) | ||
| Line 22: | Line 22: | ||
An important component of a clustering algorithm is the distance measure between data points. If the components of the data instance vectors are all in the same physical units then it is possible that the simple Euclidean distance metric is sufficient to successfully group similar data instances. However, even in this case the Euclidean distance can sometimes be misleading. Figure shown below illustrates this with an example of the width and height measurements of an object. Despite both measurements being taken in the same physical units, an informed decision has to be made as to the relative scaling. As the figure shows, different scalings can lead to different clusterings. | An important component of a clustering algorithm is the distance measure between data points. If the components of the data instance vectors are all in the same physical units then it is possible that the simple Euclidean distance metric is sufficient to successfully group similar data instances. However, even in this case the Euclidean distance can sometimes be misleading. Figure shown below illustrates this with an example of the width and height measurements of an object. Despite both measurements being taken in the same physical units, an informed decision has to be made as to the relative scaling. As the figure shows, different scalings can lead to different clusterings. | ||
| − | [[Image:scaling_Old Kiwi.gif]] | + | <center>[[Image:scaling_Old Kiwi.gif]] |
| + | '''Figure 2: Effect of Relative Scaling on Clustering''' </center> | ||
| + | |||
Note that although this may seem to be only a graphical issue, the underlying problem is with the mathematical formulas which are used to compute the distances. Therefore, in order to determine an appropriate measure of distance, we need to study the particular application and structure of the data more carefully. | Note that although this may seem to be only a graphical issue, the underlying problem is with the mathematical formulas which are used to compute the distances. Therefore, in order to determine an appropriate measure of distance, we need to study the particular application and structure of the data more carefully. | ||
Latest revision as of 11:41, 26 April 2008
Introduction
Clustering is a nonlinear activity that groups data by generating ideas, images and chunks around a stimulus point. As clustering proceeds, the groups enlarge in size, and one is able to visualize patterns and ideas. Clustering may be a class or an individual activity.
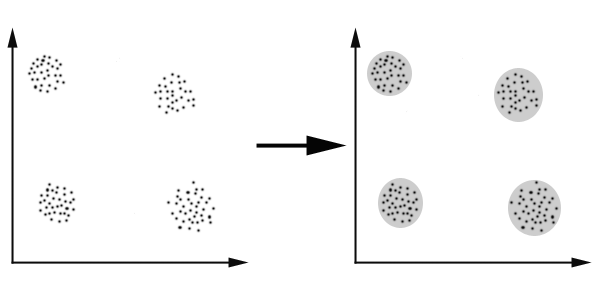
The diagram below gives a simplistic representation of clustering. Figure 1 has unclustered data initially, not necessarily grouped, and the application of a clustering algorithm results in the formation of clusters or groups, that is shown in the second figure.
 Figure 1: Simple Clustering Example
 For the data shown in Figure 1, we can easily identify the four clusters. The criteria used to separate the data is distance, which means that two or more objects will be associated with the same cluster if they are determined to be "close". This method is known as "distance-based clustering". (The alternative method is "conceptual clustering", through which objects are grouped according to descriptive/abstract attributes, as opposed to similarity measures.)
Some of the widely used algorithms for clustering include:
- K-means_Old Kiwi
- LBG_Old Kiwi
- Fuzzy C-means_Old Kiwi
- Hierarchical clustering_Old Kiwi
- Mixture of Gaussians_Old Kiwi
- ISODATA clustering_Old Kiwi
- Genetic algorithm_Old Kiwi based clustering
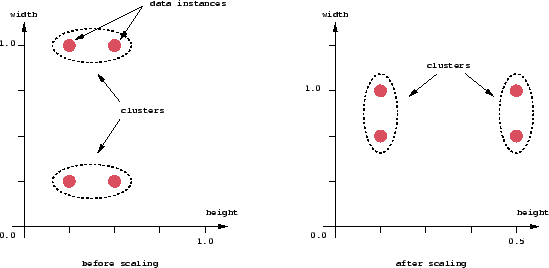
An important component of a clustering algorithm is the distance measure between data points. If the components of the data instance vectors are all in the same physical units then it is possible that the simple Euclidean distance metric is sufficient to successfully group similar data instances. However, even in this case the Euclidean distance can sometimes be misleading. Figure shown below illustrates this with an example of the width and height measurements of an object. Despite both measurements being taken in the same physical units, an informed decision has to be made as to the relative scaling. As the figure shows, different scalings can lead to different clusterings.
 Figure 2: Effect of Relative Scaling on Clustering
Note that although this may seem to be only a graphical issue, the underlying problem is with the mathematical formulas which are used to compute the distances. Therefore, in order to determine an appropriate measure of distance, we need to study the particular application and structure of the data more carefully.
References and Bibliography
From Wikipedia:
Survey Papers:
- Survey of Clustering Data Mining Techniques, by Pavel Berkhin [1]
- Survey of Clustering Algorithms, by Rui Xu and Donald Wunsch, IEEE Journal of Neural Networks, Vol 16, May 2005 [2]
Different types of clustering algorithms and their references
This classification is from the paper mentioned by Prof. Boutin in class: Andy M. Yip, Chris Ding, and Tony F. Chan, "Dynamic Cluster Formation Using Level Set Methods", IEEE TRANSACTIONS ON PATTERN ANALYSIS AND MACHINE INTELLIGENCE, VOL. 28, NO. 6, JUNE 2006.
According to this paper, clustering algorithms are classified into following types of methods:
- Optimization-based methods
 * P. Hansen and B. Jaumard, “Cluster Analysis and Mathematical Programming,” Math. Programming, vol. 79, pp. 191-215, 1997.
 * J. MacQueen, “Some Methods for Classification and Analysis Multivariate Observations,” Proc. Fifth Berkeley Symp. Math. Statistics and Probability, vol. I: Statistics, pp. 281-297, 1967.
 * A. Banerjee, S. Merugu, I. Dhillon, and J. Ghosh, “Clustering with Bregman Divergences,” Proc. Fourth SIAM Int’l Conf. Data Mining, pp. 234-245, 2004.
 * L. Kaufman and P. Rousseeuw, Finding Groups in Data: An Introduction to Cluster Analysis. John Wiley and Sons, 1990.
 * R.T. Ng and J. Han, “Efficient and Effective Clustering Methods for Spatial Data Mining,” Proc. 20th Int’l Conf. Very Large Data Bases, pp. 144-155, 1994.
- Hierarchical Methods
 * L. Kaufman and P. Rousseeuw, Finding Groups in Data: An Introduction to Cluster Analysis. John Wiley and Sons, 1990.
 * C. Ding and X. He, “Cluster Aggregate Inequality and Multi-Level Hierarchical Clustering,” Proc. Ninth European Conf. Principles of Data Mining and Knowledge Discovery, pp. 71-83, 2005.
 * G. Karypis, E. Han, and V. Kumar, “CHAMELEON: A Hierarchical Clustering Algorithm Using Dynamic Modeling,” Computer, vol. 32, pp. 68-75, 1999.
- Density-Based Methods
 * K. Fukunaga, Introduction to Statistical Pattern Recognition, second ed. Boston Academic Press, 1990.
 * M. Ester, H. Kriegel, J. Sander, and X. Xu, “A Density-Based Algorithm for Discovering Clusters in Large Spatial Databases with Noise,” Proc. Int’l Conf. Knowledge Discovery and Data Mining, pp. 226-231, 1996.
 * J. Sander, M. Ester, H. Kriegel, and X. Xu, “Density-Based Clustering in Spatial Databases: The Algorithm GDBSCAN and Its Applications,” Data Mining and Knowledge Discovery, vol. 2, no. 2, pp. 169-194, 1998.
 * R. Agrawal, J. Gehrke, D. Gunopulos, and P. Raghavan, “Automatic Subspace Clustering of High Dimensional Data for Data Mining Applications,” Proc. ACM-SIGMOD Int’l Conf. Management of Data, pp. 94-105, 1998.
 * A. Hinneburg and D.A. Keim, “An Efficient Approach to Clustering in Large Multimedia Databases with Noise,” Proc. Int’l Conf. Knowledge Discovery and Data Mining, pp. 58-65, 1998.
 * M. Ankerst, M. Breunig, H.P. Kriegel, and J. Sander, “OPTICS: Ordering Points to Identify the Clustering Structure,” Proc. ACMSIGMOD Int’l Conf. Management of Data, pp. 49-60, 1999.
- Grid-Based Methods
 * W. Wang, J. Yang, and R. Muntz, “STING: A Statistical Information Grid Approach to Spatial Data Mining,” Proc. 23rd Very Large Data Bases Conf., pp. 186-195, 1997.
 * G. Sheikholeslami, S. Chatterjee, and A. Zhang, “WaveCluster: A Wavelet-Based Clustering Approach for Spatial Data in Very Large Databases,” The Very Large Databases J., vol. 8, pp. 289-304, 2000.
- Graph-Based Methods
 * C. Ding, X. He, H. Zha, M. Gu, and H. Simon, “Spectral Min-Max Cut for Graph Partitioning and Data Clustering,” Proc. First IEEE Int’l Conf. Data Mining, pp. 107-114, 2001.
 * L. Ertoz, M. Steinbach, and V. Kumar, “Finding Clusters of Different Sizes, Shapes, and Densities in Noisy, High Dimensional Data,” Proc. Third SIAM Int’l Conf. Data Mining, pp. 47-58, 2003.
- Model-Based Methods
 * R. Sharan and R. Shamir, “CLICK: A Clustering Algorithm with Applications to Gene Expression Analysis,” Proc. Int’l Conf. Intelligent Systems for Molecular Biology, pp. 307-316, 2000.
 * G.J. McLachlan and D. Peel, Finite Mixture Models. Wiley, 2001.
The paper by Yip, Ding and Chan is based on density-based clustering methods which have the following two advantages:
 1. They allow arbitrary shapes of cluster.
 2. The algorithm does not require number of clusters as input.
A very brief outline of the algorithm implemented in the paper is as follows:
 1. Estimate the probability density of the data using kernel density estimation techniques.
 2. Peak regions are identified in the density function using the surface evolution equation implemented by Level Set method.
 3. Then a special function called Cluster Intensity Function (CIF) is constructed based on the distances. CIF captures important characteristics of clusters. For well-separated clusters, CIFs are similar to density functions. But, when
    clusters are close to each other, CIFs still clearly reveal cluster centers, cluster boundaries, and degree of membership of each data point to the cluster that it belongs.
 4. Valleys are searched on the CIF to delineate the cluster boundaries.


