(New page: %Periodic signal t = 0:0.001:20; x = sin(t); plot(t,x) image: periodic.jpg %Periodic signal turned non-periodic by setting the sampling period to 0.1 F0 =13; T0 =1/F0; Ts = 0.1; ...) |
(→Part 2) |
||
| (5 intermediate revisions by the same user not shown) | |||
| Line 1: | Line 1: | ||
| + | ==Part 1== | ||
| + | |||
| + | <pre> | ||
| + | |||
%Periodic signal | %Periodic signal | ||
t = 0:0.001:20; | t = 0:0.001:20; | ||
| Line 4: | Line 8: | ||
plot(t,x) | plot(t,x) | ||
| − | [[image: | + | </pre> |
| + | [[image: cdperiodic.jpg]] | ||
| + | <pre> | ||
%Periodic signal turned non-periodic by setting the sampling period to 0.1 | %Periodic signal turned non-periodic by setting the sampling period to 0.1 | ||
F0 =13; | F0 =13; | ||
| Line 14: | Line 20: | ||
plot(t,x) | plot(t,x) | ||
| − | [[image: | + | </pre> |
| + | |||
| + | [[image: cdnonperiodic.jpg]] | ||
| + | |||
| + | ==Part 2== | ||
| + | |||
| + | <pre> | ||
| + | %non-Periodic signal | ||
| + | t = 0:0.001:20; | ||
| + | x = exp(-t); | ||
| + | plot(t,x) | ||
| + | </pre> | ||
| + | |||
| + | [[Image:cdnunperiodic_ECE301Fall2008mboutin.jpg]] | ||
| + | |||
| + | <pre> | ||
| + | %Made periodic | ||
| + | |||
| + | t = 1:0.01:6; | ||
| + | for I = 1:1:20 | ||
| + | t = t + 6; | ||
| + | y1 = exp(-t+I*6); | ||
| + | |||
| + | plot(t,y1); | ||
| + | |||
| + | hold all | ||
| + | end | ||
| + | </pre> | ||
| + | |||
| + | [[Image:periodicnonperiodic_ECE301Fall2008mboutin.jpg]] | ||
Latest revision as of 14:45, 11 September 2008
Part 1
%Periodic signal
t  = 0:0.001:20;
x = sin(t);
plot(t,x)
%Periodic signal turned non-periodic by setting the sampling period to 0.1
F0 =13;
T0 =1/F0;
Ts = 0.1;
t  = 0:Ts:13*T0;
x = sin(2*pi*F0*t);
plot(t,x)
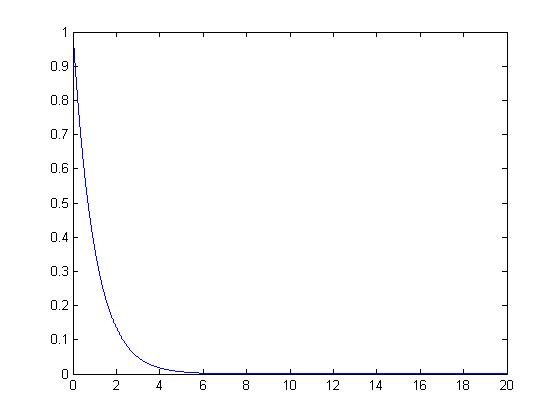
Part 2
%non-Periodic signal
t  = 0:0.001:20;
x = exp(-t);
plot(t,x)
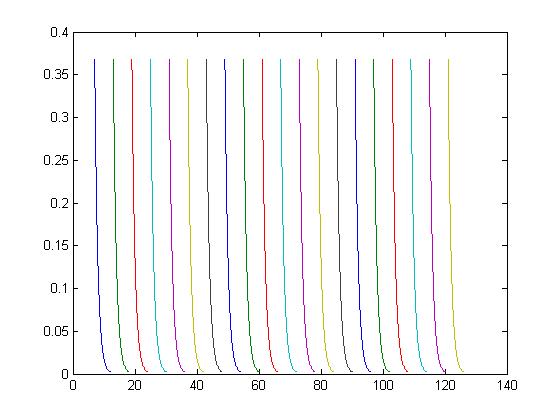
%Made periodic

t = 1:0.01:6;
for I = 1:1:20
    t = t + 6;
    y1 = exp(-t+I*6);

    plot(t,y1);

    hold all
end


