(→Revised Code) |
(→Revised Code) |
||
| Line 23: | Line 23: | ||
The problem was that the interval between points was too small. This created too few points to appear on the | The problem was that the interval between points was too small. This created too few points to appear on the | ||
graph making the graph wrong. | graph making the graph wrong. | ||
| − | + | ||
| − | The graph of the revised code. | + | The graph of the revised code.</pre> |
[[Image:F2_ECE301Fall2008mboutin.JPG]] | [[Image:F2_ECE301Fall2008mboutin.JPG]] | ||
Revision as of 17:24, 10 September 2008
Find the Bug
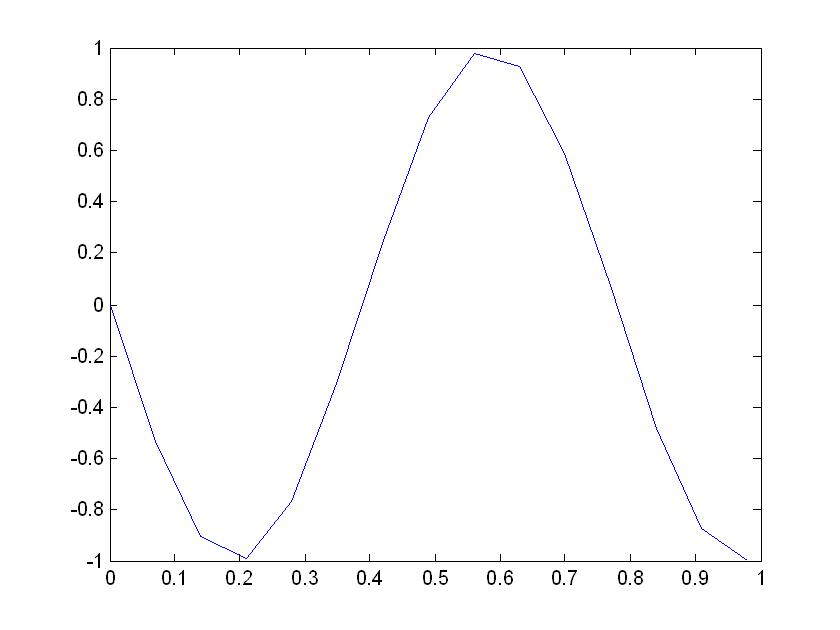
Given MATLAB code
F0 =13;
T0 =1/F0;
Ts = 0.07;
t  = 0:Ts:13*T0;
x = real(exp(j*(2*pi*F0*t-pi/2)));
plot(t,x)
The Graph of the above MATLAB code

Revised Code
The revised MATLAB code
F0 =13;
T0 =1/F0;
Ts = 0.0001;
t  = 0:Ts:13*T0;
x = real(exp(j*(2*pi*F0*t-pi/2)));
plot(t,x)
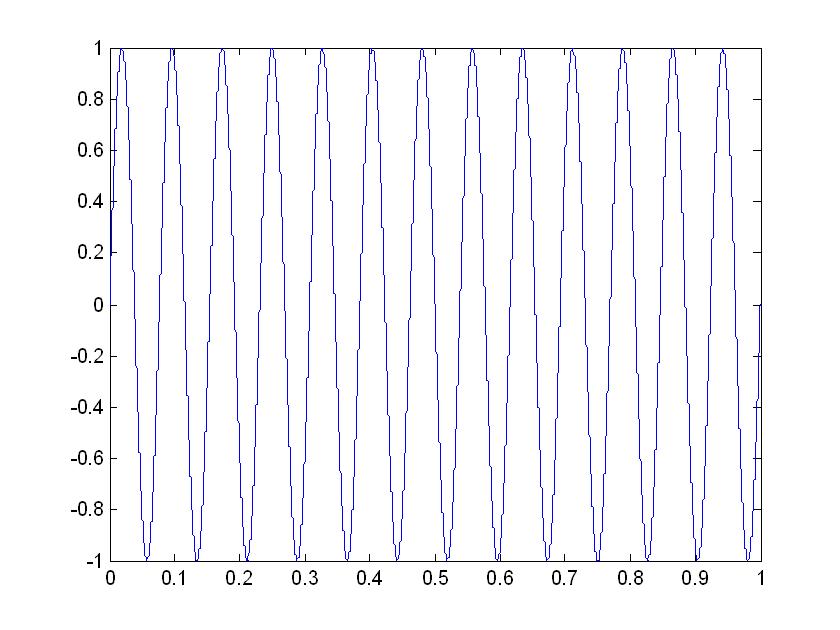
The problem was that the interval between points was too small. This created too few points to appear on the
graph making the graph wrong.

The graph of the revised code.


