(First iteration of Bernoulli Trials and Binomial Distributions page) |
(Added image for binomial distribution and continued description) |
||
| Line 11: | Line 11: | ||
<big>Binomial Distribution</big><br> | <big>Binomial Distribution</big><br> | ||
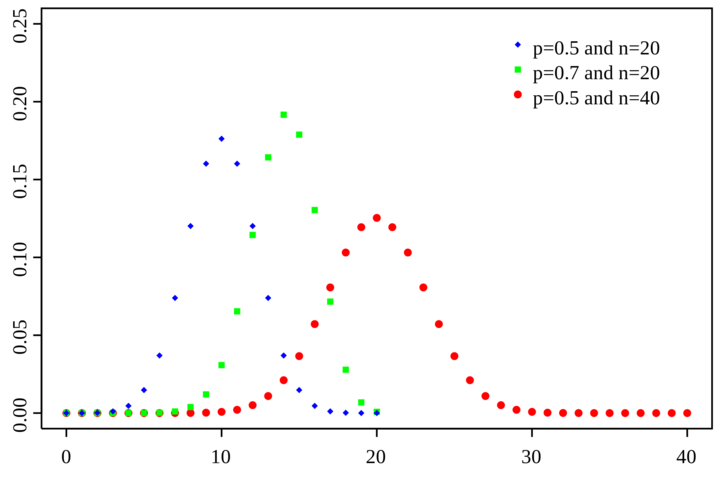
| − | A Binomial Distribution involves repeating a Bernoulli Trial some number of times, <math>n</math>, each with the same probability <math>p</math>. As such, the binomial distribution depends on both <math>n</math> and <math>p</math>. An example distribution with varying values for <math>n</math> and <math>p</math> is shown below. | + | A Binomial Distribution involves repeating a Bernoulli Trial some number of times, <math>n</math>, each with the same probability <math>p</math>. As such, the binomial distribution depends on both <math>n</math> and <math>p</math>. An example distribution with varying values for <math>n</math> and <math>p</math> is shown in the image below<sup>[https://en.wikipedia.org/wiki/Binomial_distribution#/media/File:Binomial_distribution_pmf.svg]</sup>. |
| + | |||
| + | [[File:Binomial Distribution.png|720x480px|framed|center]] | ||
| + | |||
| + | As seen in this image, the overall range of values depends solely on <math>n</math> as, with <math>n</math> trials, the event can only occur <math>0</math> to <math>n</math> times. The peak of the distribution, however, occurs at <math>np</math>, and the overall range set by <math>n</math> will affect how centralized the distribution is, with smaller ranges resulting in less variance and larger ranges resulting in greater variance. | ||
Revision as of 17:17, 2 December 2018
Bernoulli Trials and Binomial Distribution
Thus far, we have observed how $ e $ relates to compound interest and its unique properties involving Euler's Formula and the imaginary number $ i $. In this section, we will take a look at a potentially mysterious instance of how $ e $ appears when working with probability and will attempt to discover some explanations of why this occurs at all. Before we do this, however, let us begin with a few definitions.
Bernoulli Trial
Earlier in the text, we briefly learned of Daniel Bernoulli and his relation of $ e $ to compound interest using the limit definition $ \begin{align}\lim_{n \to \infty}\left(1+\frac1n\right)^n\end{align} $. We will now observe more of Bernoulli's work in the form of the Bernoulli Trial.
A Bernoulli Trial is a discrete experiment with two possible outcomes, described as "success" and "failure" of some event $ E $. In each trial, the event $ E $ has a constant probability $ p $ of occurring. Therefore, with one trial, the probability of the event occurring once is $ P(1)=p $, and the probability of the event occurring zero times is $ P(0)=1-p $.
Binomial Distribution
A Binomial Distribution involves repeating a Bernoulli Trial some number of times, $ n $, each with the same probability $ p $. As such, the binomial distribution depends on both $ n $ and $ p $. An example distribution with varying values for $ n $ and $ p $ is shown in the image below[1].
As seen in this image, the overall range of values depends solely on $ n $ as, with $ n $ trials, the event can only occur $ 0 $ to $ n $ times. The peak of the distribution, however, occurs at $ np $, and the overall range set by $ n $ will affect how centralized the distribution is, with smaller ranges resulting in less variance and larger ranges resulting in greater variance.


