(Created page with "Category:ECE438Fall2015Boutin Category:ECE438 Category:ECE Category:fourier transform Category:homework =Homework 2 Solution, ECE438,...") |
|||
| (4 intermediate revisions by the same user not shown) | |||
| Line 92: | Line 92: | ||
{| | {| | ||
|- | |- | ||
| − | | In this situation, aliasing DO occurs. In the interval of <span class="texhtml">[ − π,π]</span>, which represents one period, the | + | | In this situation, aliasing DO occurs. In the interval of <span class="texhtml">[ − π,π]</span>, which represents one period, the frequency spectrum is different from Fig b-1. |
|} | |} | ||
[[Image:Xf2 multiperiod.jpg]] | [[Image:Xf2 multiperiod.jpg]] | ||
| + | |||
| + | 2) Write MATLAB code to play the two DT signals from part a) for 2 seconds. Briefly comment on how each signal "sounds like". | ||
| + | |||
| + | f0 = 392; <br /> | ||
| + | |||
| + | n1 = 1:20000; <br /> | ||
| + | T1 = 1/1000; % above Nyquist freq <br /> | ||
| + | x1 = cos(2*pi*f0*n1*T1); <br /> | ||
| + | |||
| + | n2 = 1:20000; <br /> | ||
| + | T2 = 1/500; % below Nyquist freq <br /> | ||
| + | x2 = cos(2*pi*f0*n2*T2); <br /> | ||
| + | |||
| + | sound(x1) <br /> | ||
| + | pause(3) % pause for 3 seconds <br /> | ||
| + | sound(x2) <br /> | ||
| + | |||
| + | |||
| + | x1 makes higher notes/sounds than x2. | ||
---- | ---- | ||
| Line 104: | Line 123: | ||
---- | ---- | ||
| − | [[ | + | [[HW2ECE38F15|Back to Homework2]] |
| − | [[ | + | [[2015_Fall_ECE_438_Boutin|Back to ECE438, Fall 2014, Prof. Boutin]] |
Latest revision as of 14:54, 25 September 2015
Homework 2 Solution, ECE438, Fall 2015, Prof. Boutin
1) Pick a note frequency f0 = 392Hz
| x(t) = 'cos'(2πf0t) = 'cos'(2π ⋅ 392t) |
| $ a.\ Assign\ sampling\ period\ T_1=\frac{1}{1000} $ |
| $ 2f_0<\frac{1}{T_1}, \ No\ aliasing\ occurs. $ |
$ \begin{align} x_1(n) &=x(nT_1)=cos(2\pi \cdot 392nT_1)=cos(2\pi \cdot\frac{392}{1000}n) \\ &=\frac{1}{2}\left( e^{-j2\pi \cdot \frac{392}{1000}n} + e^{j2\pi \cdot\frac{392}{1000}n} \right) \\ \end{align} $
| $ 0<2\pi \cdot\frac{392}{1000}<\pi $ |
| $ -\pi<-2\pi \cdot\frac{392}{1000}<0 $ |
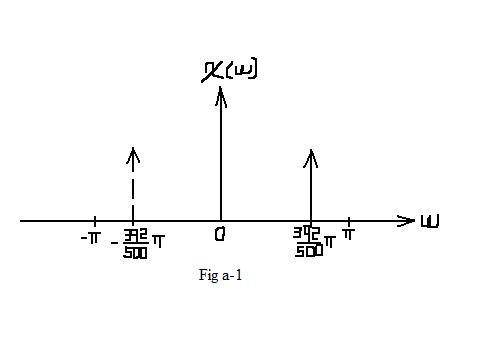
$ \begin{align} \mathcal{X}_1(\omega) &=2\pi \cdot\frac{1}{2} \left[\delta (\omega -2\pi \cdot\frac{392}{1000}) + \delta (\omega + 2\pi \cdot\frac{392}{1000})\right] \\ &=\pi \left[\delta (\omega -2\pi \cdot\frac{392}{1000}) + \delta (\omega + 2\pi \cdot\frac{392}{1000})\right] \\ \end{align} $
| $ for\ all\ \omega $ |
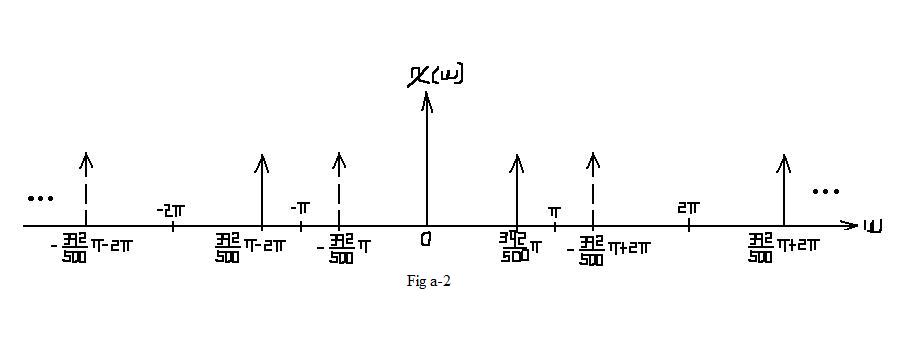
| $ \mathcal{X}_1(\omega)=\pi\cdot rep_{2\pi} \left[\delta (\omega -2\pi \cdot\frac{392}{1000}) + \delta (\omega + 2\pi \cdot\frac{392}{1000})\right] $ |
| In this situation, no aliasing occurs. In the interval of [ − π,π], which represents one period, the frequcy spectrum remains the same as Fig a-1. |
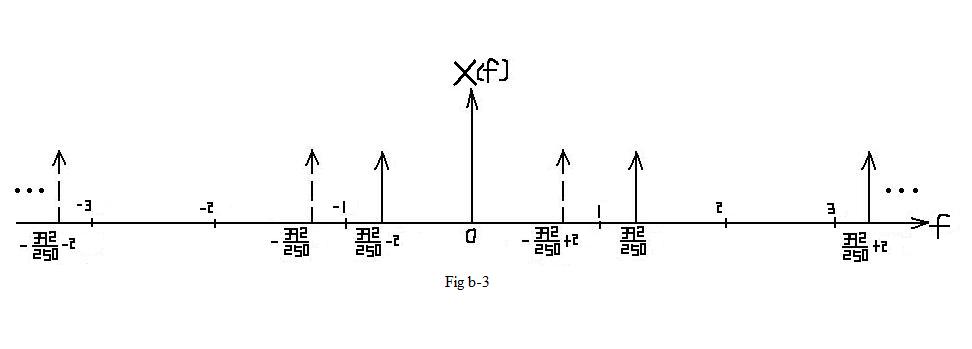
| $ b.\ Assign\ sampling\ period\ T_2=\frac{1}{500} $ |
| $ 2f_0>\frac{1}{T_2}, \ Aliasing\ occurs. $ |
$ \begin{align} x_2(n) &=x(nT_2)=cos(2\pi \cdot 392nT_2)=cos(2\pi \cdot\frac{392}{500}n) \\ &=\frac{1}{2}\left( e^{-j2\pi \cdot\frac{392}{500}n} + e^{j2\pi \cdot\frac{392}{500}n} \right) \\ \end{align} $
| $ \pi<2\pi \cdot\frac{392}{500}<2\pi $ |
| $ -2\pi<-2\pi \cdot\frac{392}{500}<\pi $ |
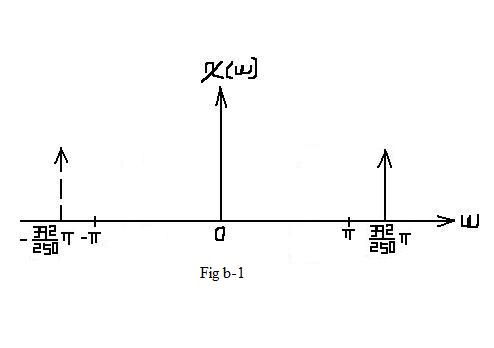
| $ \mathcal{X}_2(\omega)=\pi \left[\delta (\omega -2\pi \cdot\frac{392}{500}) + \delta (\omega + 2\pi \cdot\frac{392}{500})\right] $ |
| $ X_2(f)=\frac{1}{2}\left[\delta (f -\frac{392}{500}) + \delta (f + \frac{392}{500})\right] $ |
| $ for\ all\ \omega $ |
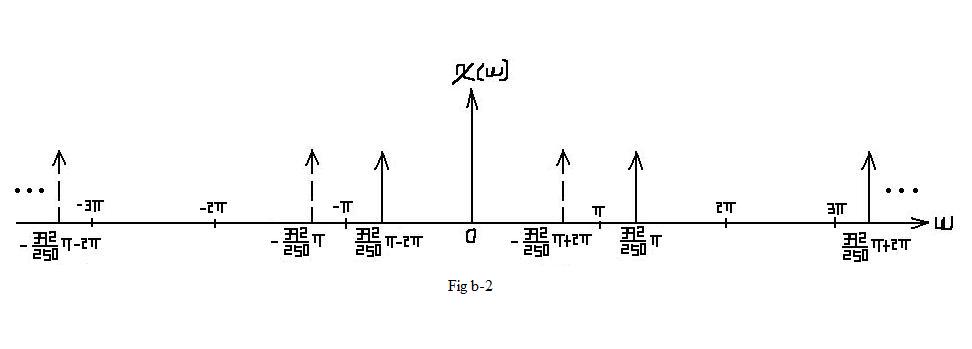
| $ \mathcal{X}_2(\omega)=\pi\cdot rep_{2\pi} \left[\delta (\omega -2\pi \cdot\frac{392}{500}) + \delta (\omega + 2\pi \cdot\frac{392}{500})\right] $ |
| $ X_2(f)=\frac{1}{2}rep_2\left[\delta (f -\frac{392}{500}) + \delta (f + \frac{392}{500})\right] $ |
| In this situation, aliasing DO occurs. In the interval of [ − π,π], which represents one period, the frequency spectrum is different from Fig b-1. |
2) Write MATLAB code to play the two DT signals from part a) for 2 seconds. Briefly comment on how each signal "sounds like".
f0 = 392;
n1 = 1:20000;
T1 = 1/1000; % above Nyquist freq
x1 = cos(2*pi*f0*n1*T1);
n2 = 1:20000;
T2 = 1/500; % below Nyquist freq
x2 = cos(2*pi*f0*n2*T2);
sound(x1)
pause(3) % pause for 3 seconds
sound(x2)
x1 makes higher notes/sounds than x2.
Discussion
You may discuss the homework below.
- write comment/question here
- answer will go here

