| (23 intermediate revisions by 2 users not shown) | |||
| Line 1: | Line 1: | ||
| − | == ''' Vocal | + | [[Category:male versus female voice]] |
| + | [[Category:speech]] | ||
| + | [[Category:digital signal processing]] | ||
| + | [[Category:ECE438]] | ||
| + | |||
| + | == ''' [[:Category:Speech|Human Vocal system]] and properties''' == | ||
| + | A [[Student_projects|student project]] for the course [[ECE438]], by [[ECE]] student [[User:Apanja|Ananya Panja]] | ||
---- | ---- | ||
| − | + | [[Image:File7.jpg|upright|left|alt text]] | |
| − | + | ||
== In case of Humans== | == In case of Humans== | ||
---- | ---- | ||
| − | == Male and female voice characterstics== | + | == Male and female [[:Category:Speech|voice]] characterstics== |
| + | The 2 vocal properties are intensity(loudness) and frequency(pitch).Pitch of a man's voice fall under low frequency,where as woman's voice is of the high pitch type.Pitch and intensity are proportional to each other. | ||
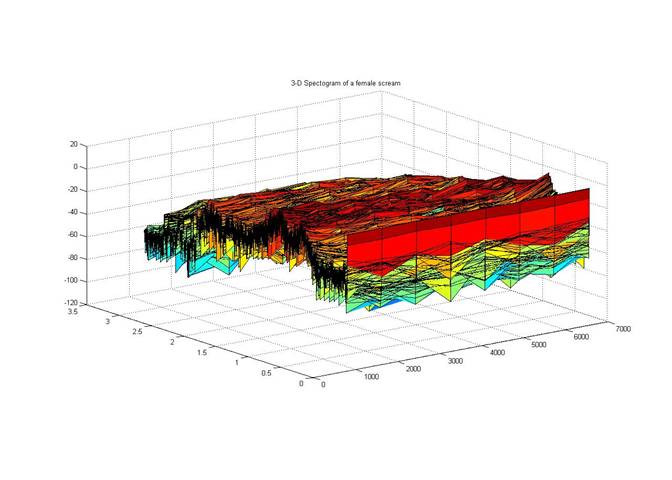
| + | As seen in the spectrograms beneath,we can compare the intensities of male vs female voice.Female's voice has more frequency components compared to men.Women speak at one octave higher than men.Even though in the graphs underneath show that a man's voice (while screaming) has a 1 high frequency component ,and than has low intensity after that.Whereas,female's voice has a band of median intensity and gradually tapers towards end. | ||
| − | + | [[Media:man_scream.wav]] | |
| − | + | [[Image:File5.jpg|upright|left|alt text]] | |
| − | + | ||
| − | |||
| − | + | [[Image:File2.jpg|upright|left|alt text]] | |
| + | [[Media:female_scream.wav]] | ||
| − | == | + | |
| + | [[Image:File6.jpg|upright|left|alt text]] | ||
| + | |||
| + | |||
| + | [[Image:File4.jpg|upright|left|alt text]] | ||
| + | |||
| + | |||
| + | |||
| + | == Spectrograms== | ||
| + | |||
| + | Spectrograms are used to show spectral density.It has a horizontal axis of time,a vertical axis showing the frequency and a third axis showing the intensity.For a given spectrogram S, the strength of a given frequency component f at a given time t in the speech signal is represented by the darkness or color of the corresponding point S(t,f).The color red depicts high intensity and yellow, green shows medium intensity and blue hows low intensity ,gray and gradually white depicts that the intensity is under the threshold level.Spectrograms are based on Short Time Fourier Transform(STFT),where the input signal is broken down into blocks and then DFT of each block is take and averaged to find the spectral density.Generally Spectrograms are done in gray scale,where the darkness of a plot represents the high intensity regions. | ||
| + | |||
| + | ---- | ||
| + | --[[User:Apanja|Apanja]] 03:47, 29 October 2009 (UTC)Ananya Panja | ||
| + | ---- | ||
Latest revision as of 05:07, 23 September 2014
Contents
Human Vocal system and properties
A student project for the course ECE438, by ECE student Ananya Panja
In case of Humans
Male and female voice characterstics
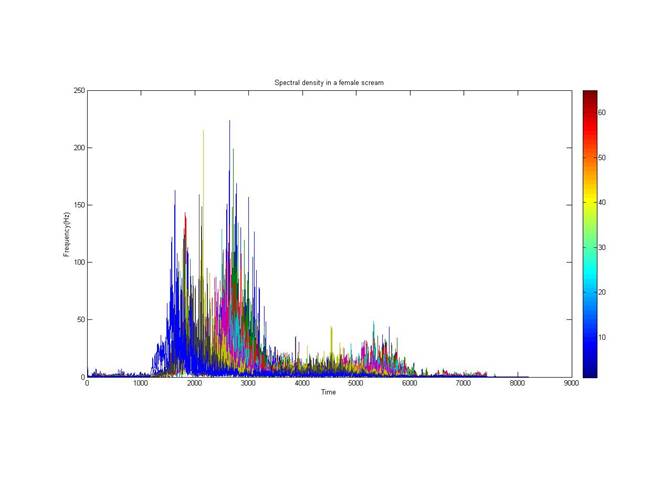
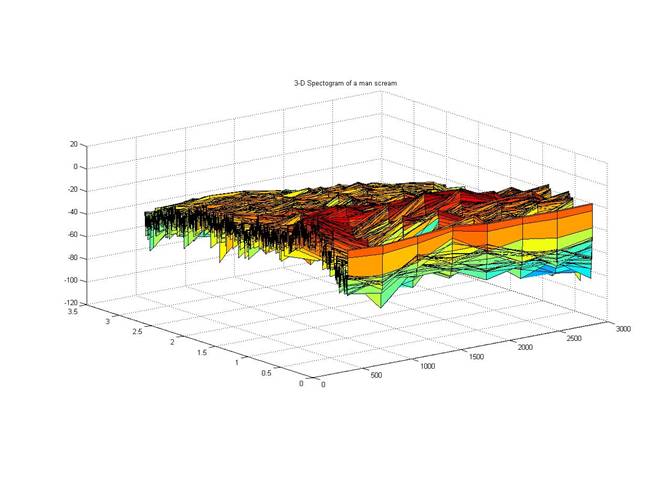
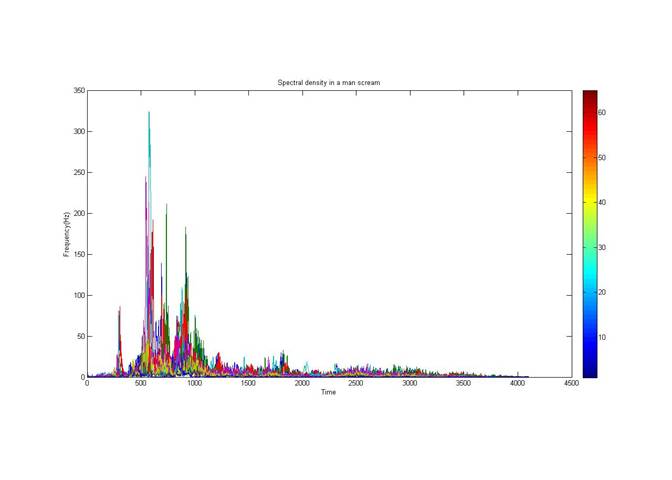
The 2 vocal properties are intensity(loudness) and frequency(pitch).Pitch of a man's voice fall under low frequency,where as woman's voice is of the high pitch type.Pitch and intensity are proportional to each other. As seen in the spectrograms beneath,we can compare the intensities of male vs female voice.Female's voice has more frequency components compared to men.Women speak at one octave higher than men.Even though in the graphs underneath show that a man's voice (while screaming) has a 1 high frequency component ,and than has low intensity after that.Whereas,female's voice has a band of median intensity and gradually tapers towards end.
Spectrograms
Spectrograms are used to show spectral density.It has a horizontal axis of time,a vertical axis showing the frequency and a third axis showing the intensity.For a given spectrogram S, the strength of a given frequency component f at a given time t in the speech signal is represented by the darkness or color of the corresponding point S(t,f).The color red depicts high intensity and yellow, green shows medium intensity and blue hows low intensity ,gray and gradually white depicts that the intensity is under the threshold level.Spectrograms are based on Short Time Fourier Transform(STFT),where the input signal is broken down into blocks and then DFT of each block is take and averaged to find the spectral density.Generally Spectrograms are done in gray scale,where the darkness of a plot represents the high intensity regions.
--Apanja 03:47, 29 October 2009 (UTC)Ananya Panja

