| (5 intermediate revisions by 3 users not shown) | |||
| Line 1: | Line 1: | ||
| + | [[Category:bonus point project]] | ||
| + | [[Category:ECE]] | ||
| + | [[Category:ECE438]] | ||
| + | [[Category:signal processing]] | ||
| + | [[Category:sampling]] | ||
| + | |||
===Up sampling and Down sampling=== | ===Up sampling and Down sampling=== | ||
| Line 41: | Line 47: | ||
==Matlab Code== | ==Matlab Code== | ||
| + | [[Media:project_test.pdf|project_test.pdf]] | ||
| + | |||
| − | [[Media: | + | [[Media:whosyourmommy.pdf|function.pdf]] |
Latest revision as of 05:37, 25 September 2013
Up sampling and Down sampling
Abstract
Filtering a signal by up samping in matlab is able to change the original frequency of the signal by a mutiplying it with an integer, and filtering a signal by down samping in matlab is able to change the original frequency of the signal by a dividing it by an integer. For example, by using the method above, a pure frequency signal with pitch C can be transfer to #C or bC. However, if the signal C needs to be transfer to D or F, then simply mutiplying or dvivding the original frequency by integer is not going to work. Instead, the original frequency needs to be mutiplied by a fraction number. Thus the goal of this project is to design a Matlab function to mutiply the input signal frequency by a fraction to make a arbitary change of the pitch of the input signal.
Theory
Up-Sampling is a "Zero-Padding Procedure" that increase the number of samples of a DT signal. More specificals, when up sampling, zeros are added between the samples of a signal. Down-Sampling is to decrease the sample size. In the other word, it divides the input signal into segments, and pick a point from each segment to form a new signal.
Relevant Source
http://en.wikipedia.org/wiki/Upsampling
http://en.wikipedia.org/wiki/Downsampling
Procedure
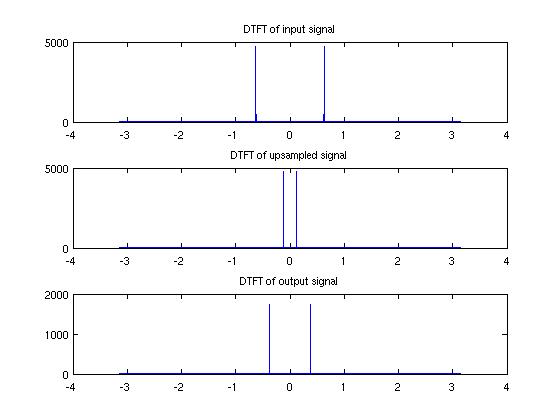
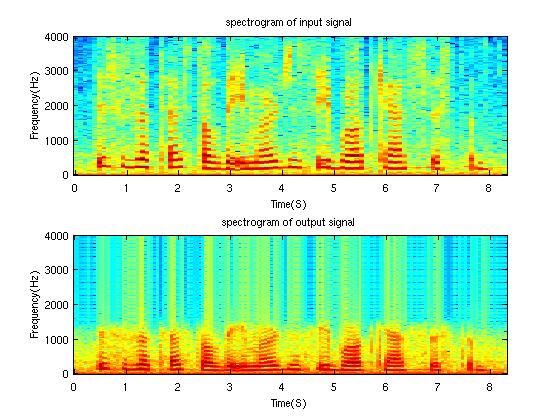
- Let input be a pure frequency, i.e. a sine wave function. Up sample by factor of 5 then down sample by factor 3. To avoid aliasing, the filter was build by MATLAB embedded function "fir1" with order= 20, cut-of frequency =1/5.
According to above graph, the output signal is up-sampled by 5/3
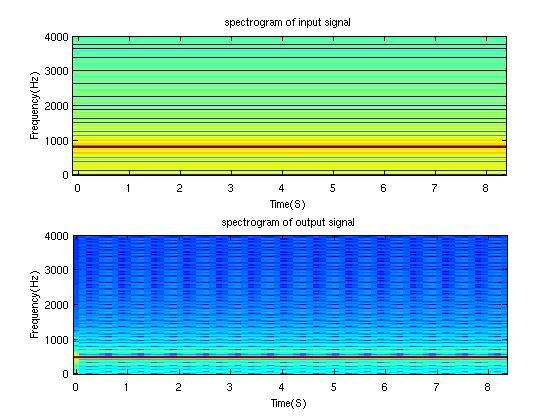
In frequency domain, the signal was decreased by factor of 3/5, as the figure indicated above.
We can see the energy concentrate at 800 Hz and 500 Hz for input and output respectively.
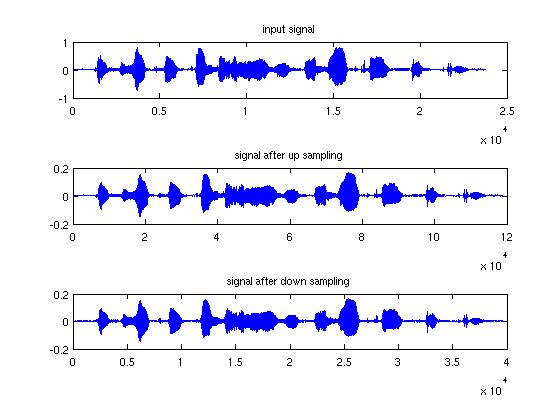
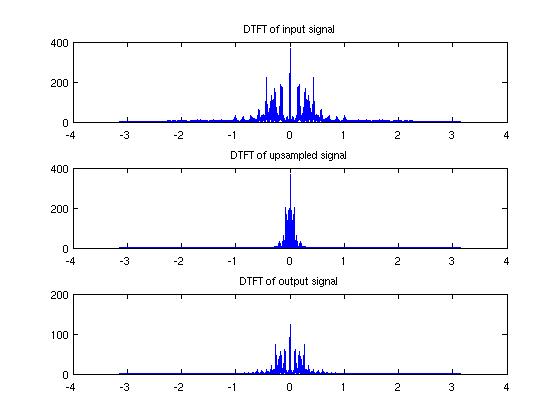
Conclusion
The function designed in this project is able to adjust signal frequency by arbitary amount. The method is to up sample the input and then down sample it.


