(New page: Category:ECE301Spring2013JVK Category:ECE Category:ECE301 Category:signalandsystems Category:problem solving Category:Fourier series The question stated: ''2. Use...) |
|||
| (One intermediate revision by the same user not shown) | |||
| Line 1: | Line 1: | ||
[[Category:ECE301Spring2013JVK]] [[Category:ECE]] [[Category:ECE301]] [[Category:signalandsystems]] [[Category:problem solving]] | [[Category:ECE301Spring2013JVK]] [[Category:ECE]] [[Category:ECE301]] [[Category:signalandsystems]] [[Category:problem solving]] | ||
| + | [[Category:Impulse Response]] | ||
[[Category:Fourier series]] | [[Category:Fourier series]] | ||
| + | [[Category:FFT]] | ||
| + | |||
| + | The question stated: | ||
| + | ''1. Find out what the impulse response is called in the math literature and then find and state some theorems relating the concept to solutions of ODEs.'' | ||
| + | |||
| + | An impulse response can be called "Green's Function" in math literature. | ||
| + | |||
The question stated: | The question stated: | ||
| Line 29: | Line 37: | ||
As the number of terms in the FS increased the overshoot became more pronounced around k = 25, but around k = 100 it smoothed out and adhered more to the look of a sawtooth wave. | As the number of terms in the FS increased the overshoot became more pronounced around k = 25, but around k = 100 it smoothed out and adhered more to the look of a sawtooth wave. | ||
| + | |||
| + | The question stated: | ||
| + | |||
| + | ''3. In this question you will perform spatial filtering operations on an image. The code should be implemented in Matlab. Use the following image. (Hint. Use these functions: imread, fspecial, fftshift, fft2, imfilter, imshow, surf).'' | ||
| + | |||
| + | ''a) Read the image'' | ||
| + | |||
| + | ''b) Create Gaussian filter of size 5x5 with mean 0 and standard deviation 3.'' | ||
| + | |||
| + | ''c) Plot Fourier Transform of filter’s impulse response in 3D.'' | ||
| + | |||
| + | ''d) Apply filter to the original image and explain the result'' | ||
| + | |||
| + | ''e) Create “unsharp” filter.'' | ||
| + | |||
| + | ''f) Plot Fourier Transform of filter’s impulse response in 3D.'' | ||
| + | |||
| + | ''g) Apply filter to the original image and explain the result'' | ||
| + | |||
| + | ''h) Attach filtered images, and 3D plots of FT.'' | ||
| + | |||
| + | [[Image:Mtgyure_GaussianFrequencyResponse.png]] | ||
| + | |||
| + | [[Image:Mtgyure_GaussianImage.png]] | ||
| + | |||
| + | The Gaussian Filter adds a softer blurring filter to the image. It "smooths" the whole images out. | ||
| + | |||
| + | [[Image:Mtgyure_UnsharpFrequencyResponse.png]] | ||
| + | |||
| + | [[Image:Mtgyure_UnsharpImage.png]] | ||
| + | |||
| + | The Unsharp filter sharpens the whole of the image. The lines and artifacting become more pronounced. | ||
[[ECE301bonus2|Back to the 2nd bonus point opportunity, ECE301 Spring 2013]] | [[ECE301bonus2|Back to the 2nd bonus point opportunity, ECE301 Spring 2013]] | ||
Latest revision as of 09:50, 11 March 2013
The question stated:
1. Find out what the impulse response is called in the math literature and then find and state some theorems relating the concept to solutions of ODEs.
An impulse response can be called "Green's Function" in math literature.
The question stated:
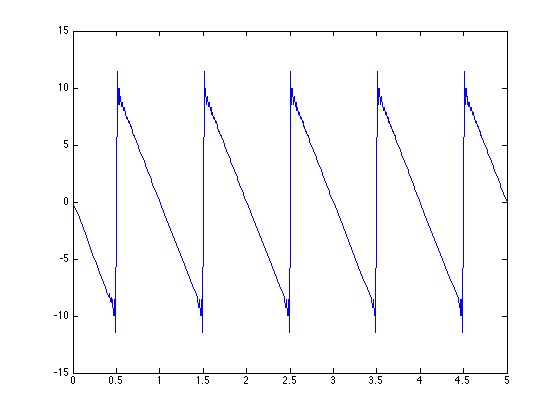
2. Use Matlab to demonstrate summing of a finite number of terms of a Fourier Series ... pick a fun time function with a discontinuity to illustrate Gibbs phenomena. How does the Gibbs overshoot behave as the number of terms in the FS increases?
The function chosen was a sawtooth wave with frequency 1.
k = 5
k = 10
k = 25
k = 50
k = 100
As the number of terms in the FS increased the overshoot became more pronounced around k = 25, but around k = 100 it smoothed out and adhered more to the look of a sawtooth wave.
The question stated:
3. In this question you will perform spatial filtering operations on an image. The code should be implemented in Matlab. Use the following image. (Hint. Use these functions: imread, fspecial, fftshift, fft2, imfilter, imshow, surf).
a) Read the image
b) Create Gaussian filter of size 5x5 with mean 0 and standard deviation 3.
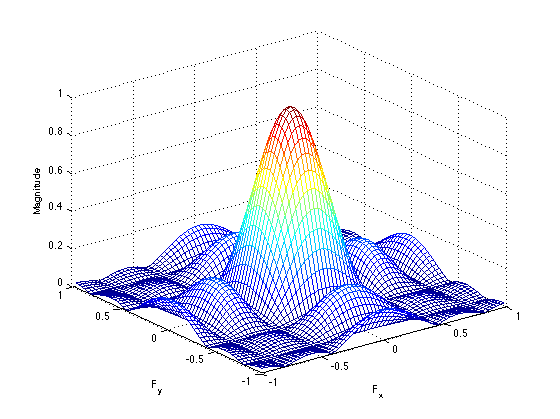
c) Plot Fourier Transform of filter’s impulse response in 3D.
d) Apply filter to the original image and explain the result
e) Create “unsharp” filter.
f) Plot Fourier Transform of filter’s impulse response in 3D.
g) Apply filter to the original image and explain the result
h) Attach filtered images, and 3D plots of FT.
The Gaussian Filter adds a softer blurring filter to the image. It "smooths" the whole images out.
The Unsharp filter sharpens the whole of the image. The lines and artifacting become more pronounced.


