(New page: Category:ECE301Spring2013JVK Category:ECE Category:ECE301 Category:signalandsystems Category:problem solving Category:Impulse Response An impulse response if often...) |
|||
| Line 29: | Line 29: | ||
•f3 = fftshift(picture,3); | •f3 = fftshift(picture,3); | ||
imshow(f3) | imshow(f3) | ||
| + | |||
| + | [[Image:fftshift.jpg]] | ||
•filter = imfilter(picture,G); | •filter = imfilter(picture,G); | ||
| Line 34: | Line 36: | ||
Gaussian image | Gaussian image | ||
| + | [[Image:gaussian.jpg]] | ||
| + | |||
Adding a filter of Gaussian Fourier series makes the image blurry because of the low pass filter which eliminates the frequency however the image does not come in properly so the image becomes blurry. | Adding a filter of Gaussian Fourier series makes the image blurry because of the low pass filter which eliminates the frequency however the image does not come in properly so the image becomes blurry. | ||
•s = fspecial('unsharp'); | •s = fspecial('unsharp'); | ||
| Line 39: | Line 43: | ||
imshow(f4) | imshow(f4) | ||
“Unsharp” image | “Unsharp” image | ||
| − | + | ||
| + | [[Image:sharp.jpg]] | ||
| + | |||
This image is filtered with “unsharp” which is a contrast enhancement filter. With “unsharp” they create it from the negative of the laplacian filter with an alpha which was specified at 0.2. | This image is filtered with “unsharp” which is a contrast enhancement filter. With “unsharp” they create it from the negative of the laplacian filter with an alpha which was specified at 0.2. | ||
[[ECE301bonus2|Back to the 2nd bonus point opportunity, ECE301 Spring 2013]] | [[ECE301bonus2|Back to the 2nd bonus point opportunity, ECE301 Spring 2013]] | ||
Latest revision as of 06:35, 11 March 2013
An impulse response if often noted as the dirac delta function of green’s function. Some theorems relating greens function of ODE’s is:
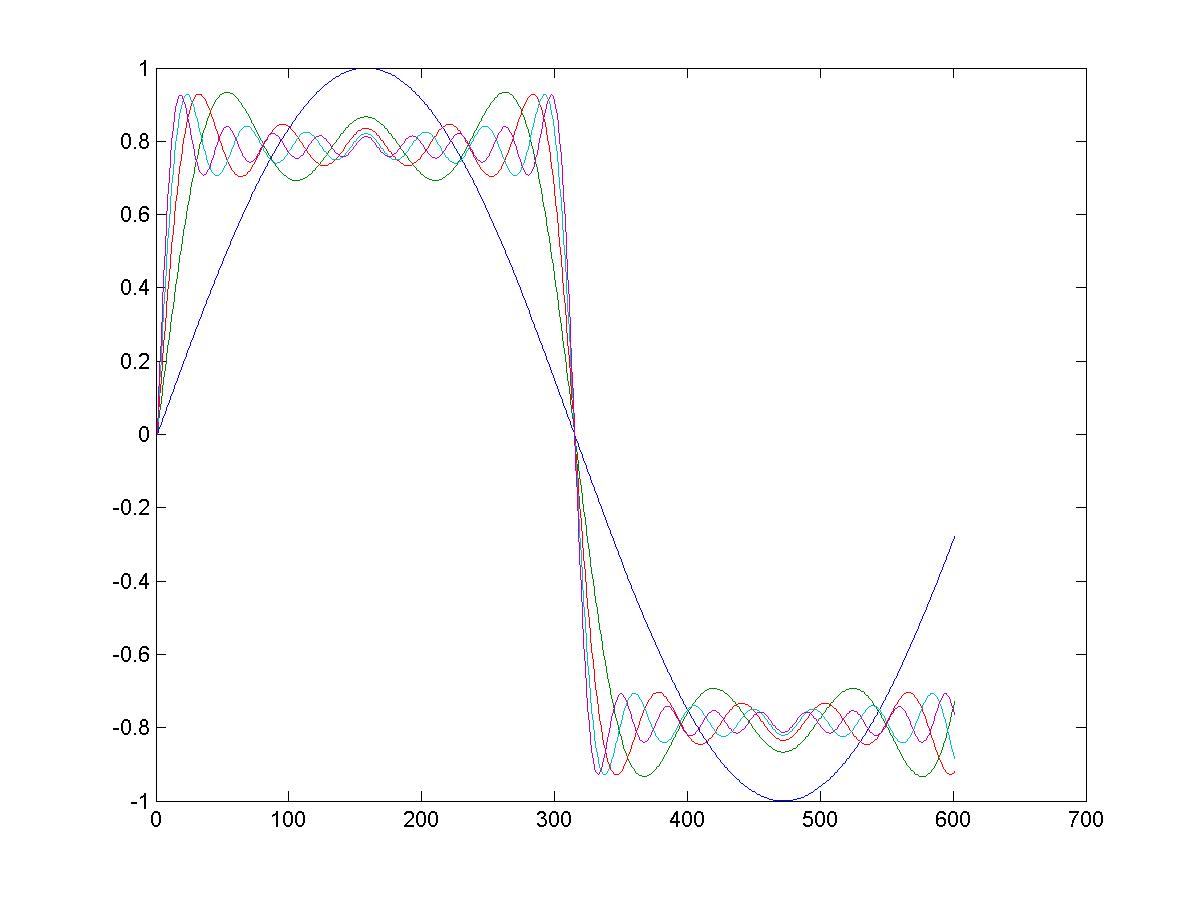
•Greens function for homogeneous equation: Ly(x)+ λw(x)y(x)=0 •Greens function for inhomogeneous equation: (L + λw(x)) G(x, x’) = δ(x-x’) where G(x,x’) is green’s function. And δ is the dirac delta function. •Greens function in terms of Eigen functions: Greens function only needs to computed once for any given value and it can be used to solve any function on the RHS of an equation. t = 0:.01:6; y = zeros(10,length(t)); x = zeros(size(t)); for k = 1:2:25
   x = x+sin(k*t)/k;
   y((k+1)/2,:) = x;
end plot(y(1:2:9,:)')
This shows the Fourier series of a square wave from sin waves. Gibbs overshoot behaves as the number of terms increases, the maximum overshoot is achieved closer to discontinuity and once it passes a certain amount of terms, convergence is possible. Spatial filtering operations on an image •Picture = imread(‘lena.jpg’); •G = fspecial('gaussian',[5 5],3); •f3 = fftshift(picture,3); imshow(f3)
•filter = imfilter(picture,G);
imshow(filter)
Gaussian image
Adding a filter of Gaussian Fourier series makes the image blurry because of the low pass filter which eliminates the frequency however the image does not come in properly so the image becomes blurry. •s = fspecial('unsharp'); f4 = imfilter(picture,s); imshow(f4) “Unsharp” image
This image is filtered with “unsharp” which is a contrast enhancement filter. With “unsharp” they create it from the negative of the laplacian filter with an alpha which was specified at 0.2.


