| Line 69: | Line 69: | ||
</math> | </math> | ||
| − | (c) The FT of the signal after sampling with sampling period <math | + | (c) The FT of the signal after sampling with sampling period <math>T=2</math> is shown in the figure below. |
[[Image:301_sp2011_boutin_hw9_figure4.jpg]] | [[Image:301_sp2011_boutin_hw9_figure4.jpg]] | ||
Revision as of 20:19, 7 April 2011
Homework 9 Solutions, ECE301 Spring 2011 Prof. Boutin
Students should feel free to make comments/corrections or ask questions directly on this page.
Question 1
(a) The given signal has finite duration and hence it is not band-limited.
(b) The given signal has finite duration and hence it is not band-limited.
(c) The given signal has infinite duration and hence it is band-limited.
(d) The given signal has infinite duration and hence it is band-limited.
Question 2
$ x(t)=e^{j\pi t}\frac{\sin(\pi t)}{t}=\pi e^{j\pi t}\frac{\sin(\pi t)}{\pi t} $
Using frequency shift property of FT, we get:
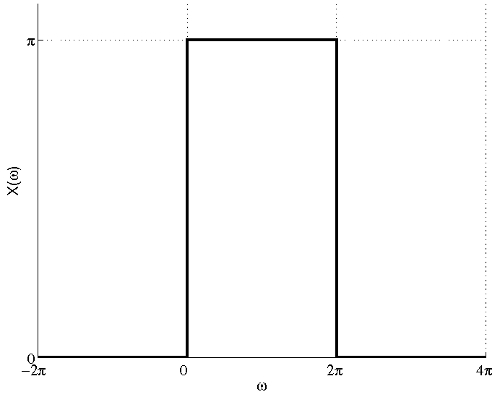
$ \begin{align} \mathcal{X}(\omega)&=\left\{\begin{array}{ll} \pi , & \mbox{ for } |\omega - \pi|<\pi \\ 0, & \mbox{ elsewhere} \end{array}\right. \\ &=\left\{\begin{array}{ll} \pi , & \mbox{ for } -\pi <\omega-\pi<\pi \\ 0, & \mbox{ elsewhere} \end{array}\right. \\ &=\left\{\begin{array}{ll} \pi , & \mbox{ for } 0<\omega<2\pi \\ 0, & \mbox{ elsewhere} \end{array}\right. \end{align} $
The figure below shows the plot of the FT of $ x(t) $.
After sampling with a sampling period T, we get:
$ \mathcal{Y}(\omega)=\frac{1}{2\pi}\mathcal{X}(\omega)*\mathcal{P}(\omega)=\frac{1}{T}\sum_{k=-\infty}^{k=\infty}\mathcal{X}(\omega-\frac{2\pi k}{T}) $
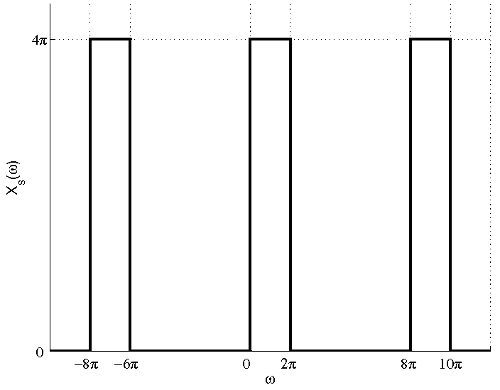
(a) The FT of the signal after sampling with sampling period $ T=\frac{1}{4} $ is shown in the figure below.
From the figure, we can see that there is no aliasing and the signal can be recovered by filtering the sampled signal using the following filter:
$ \mathcal{H}(\omega)=\left\{\begin{array}{ll} \frac{1}{4} , & \mbox{ for } |\omega - \pi|<\pi \\ 0, & \mbox{ elsewhere} \end{array}\right. $
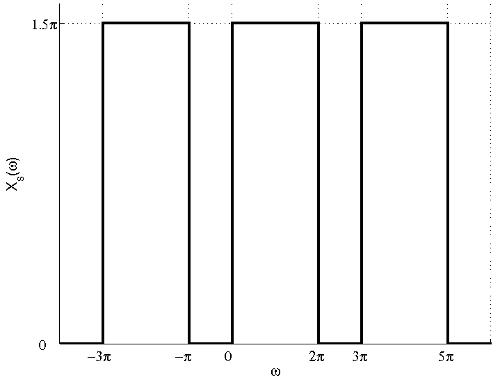
(b) The FT of the signal after sampling with sampling period $ T=\frac{2}{3} $ is shown in the figure below.
From the figure, we can see that there is no aliasing and the signal can be recovered by filtering the sampled signal using the following filter:
$ \mathcal{H}(\omega)=\left\{\begin{array}{ll} \frac{2}{3} , & \mbox{ for } |\omega - \pi|<\pi \\ 0, & \mbox{ elsewhere} \end{array}\right. $
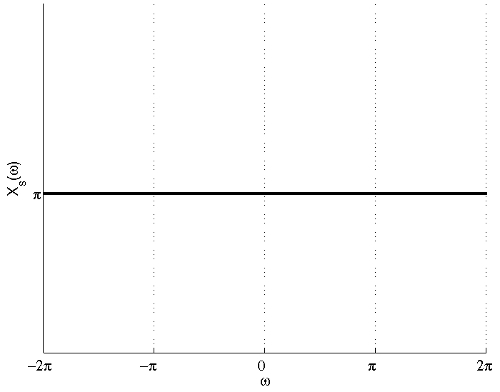
(c) The FT of the signal after sampling with sampling period $ T=2 $ is shown in the figure below.
From the figure, we can see that there is aliasing and thus the signal cannot be recovered.


