| Line 9: | Line 9: | ||
:Standard Deviation: 19.9 | :Standard Deviation: 19.9 | ||
| + | <span style="color:green"> Grade Lines: </span> | ||
| + | ::<span style="color:green"> A >99 </span> | ||
| + | ::<span style="color:green"> B >64 </span> | ||
| + | ::<span style="color:green"> C >64 </span> | ||
| + | ::<span style="color:green"> Anything below 25 is highly problematic... </span> | ||
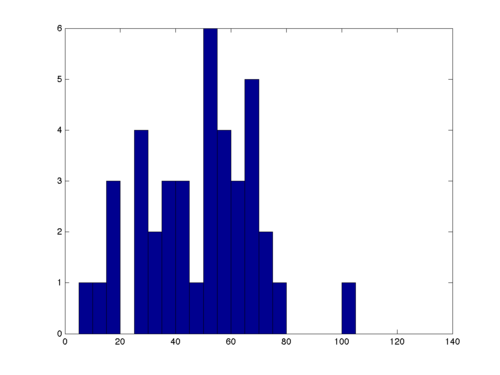
[[Image:midterm1histECE438F10.png|500px]] | [[Image:midterm1histECE438F10.png|500px]] | ||
---- | ---- | ||
[[2010_Fall_ECE_438_Boutin|Back to ECE438 Fall 2010, Prof. Boutin]] | [[2010_Fall_ECE_438_Boutin|Back to ECE438 Fall 2010, Prof. Boutin]] | ||
Revision as of 08:11, 13 October 2010
Midterm 1 Statistics
Digital Signal Processing (ECE438) Fall 2010, Prof. Boutin
- Total Number of Points: 120
- Max 101
- Min 9
- Mean 48.7
- Median 52
- Standard Deviation: 19.9
Grade Lines:
- A >99
- B >64
- C >64
- Anything below 25 is highly problematic...


