| Line 1: | Line 1: | ||
---- | ---- | ||
| − | == Spectral Analysis of 2D Signals ( | + | == Spectral Analysis of 2D Signals (December 1, 2009) == |
| + | ---- | ||
| + | |||
<blockquote>'''Here, I will describe and explain the basics behind analyzing the spectrum of 2-D signals - principally images!''' | <blockquote>'''Here, I will describe and explain the basics behind analyzing the spectrum of 2-D signals - principally images!''' | ||
- Ryan Scheidt</blockquote> | - Ryan Scheidt</blockquote> | ||
Revision as of 12:12, 25 November 2009
Spectral Analysis of 2D Signals (December 1, 2009)
Here, I will describe and explain the basics behind analyzing the spectrum of 2-D signals - principally images! - Ryan Scheidt
The following image, referred to as "Lena" is a famous image utilized in image processing algorithms. Here are some links: [1], [2]
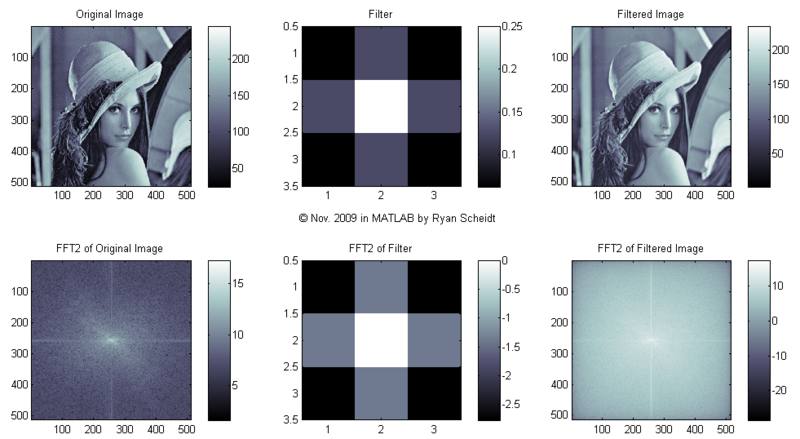
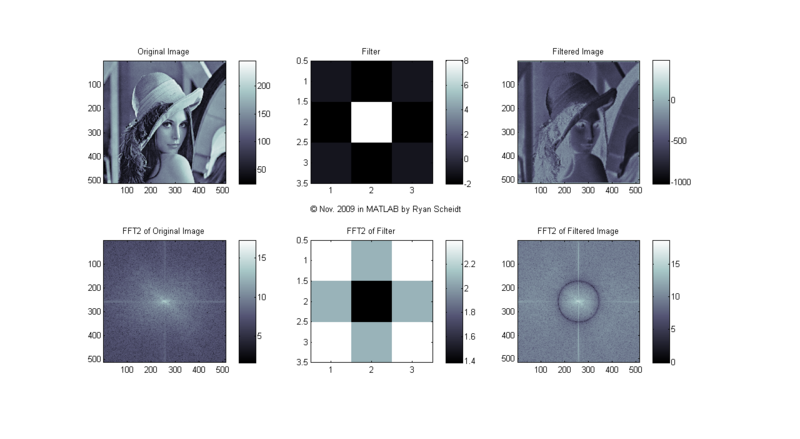
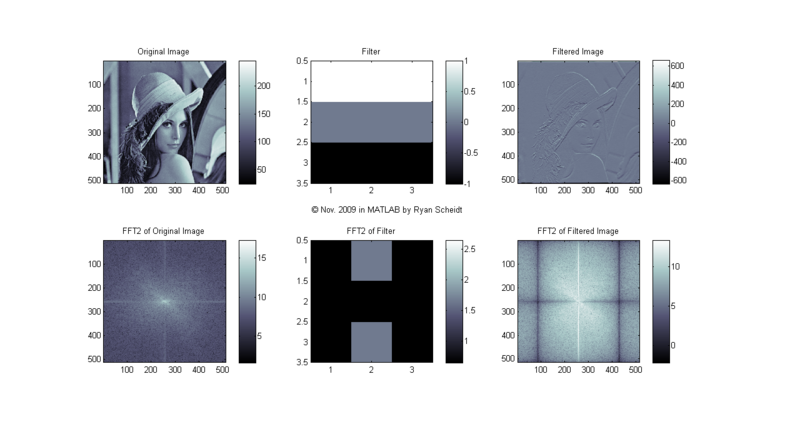
Here are three different 3X3 filters. The pictures show the original image (Lena), the filter, and the filtered image (done with conv2). MATLAB m-files available upon request.
Note: click on following images and follow "Full resolution" hyperlink to see full image (e.g. 1280 pixels wide).


