| Line 2: | Line 2: | ||
| − | [[Image: | + | [[Image:mixofgauss_OldKiwi.jpg]] |
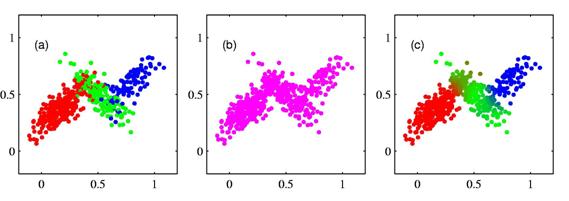
First plot shows the actual classes of the dataset, second plot shows the situation in which we do not know the label of the data points, and the third one shows the data points classified based on their responsibilities. As can be seen close data points do not have a solid color, because the close points have very close responsibilities for related classes. | First plot shows the actual classes of the dataset, second plot shows the situation in which we do not know the label of the data points, and the third one shows the data points classified based on their responsibilities. As can be seen close data points do not have a solid color, because the close points have very close responsibilities for related classes. | ||
Latest revision as of 14:11, 24 April 2008
One of the famous mixture models is mixture of Gaussians. Mixture of Gaussians simply tries to fit several Gaussian distributions to the dataset. The number of the Gaussians are assumed to be known a priory. Each point has a probability for being drawn from a particular Gaussian distribution. This probability is called responsibility associated with a data point. Here is a good figure to explain the idea clearly from C. M. Bishop's book [1].
First plot shows the actual classes of the dataset, second plot shows the situation in which we do not know the label of the data points, and the third one shows the data points classified based on their responsibilities. As can be seen close data points do not have a solid color, because the close points have very close responsibilities for related classes.


