(New page: ==A-1 Creating two DT signals (one periodic and one non-periodic) from a periodic CT signal== I choose <math>x(t) = sin (2\pi t),</math> which is a periodic CT signal original plot: [[Ima...) |
|||
| Line 3: | Line 3: | ||
I choose <math>x(t) = sin (2\pi t),</math> which is a periodic CT signal | I choose <math>x(t) = sin (2\pi t),</math> which is a periodic CT signal | ||
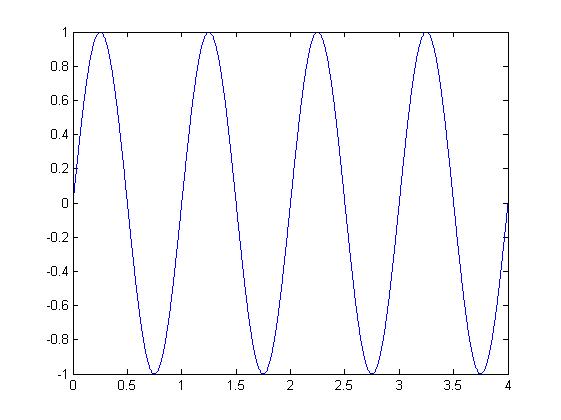
original plot: | original plot: | ||
| − | [[Image: | + | [[Image:hw1-1_ECE301Fall2008mboutin.jpg]] |
<math>x(t) = sin (2\pi t)</math> | <math>x(t) = sin (2\pi t)</math> | ||
| − | [[Image: | + | [[Image:hw2-1_ECE301Fall2008mboutin.jpg]] |
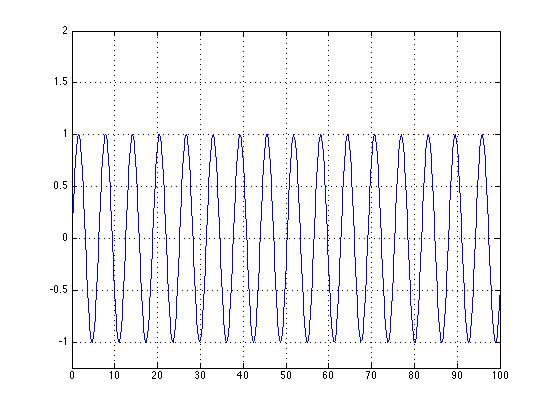
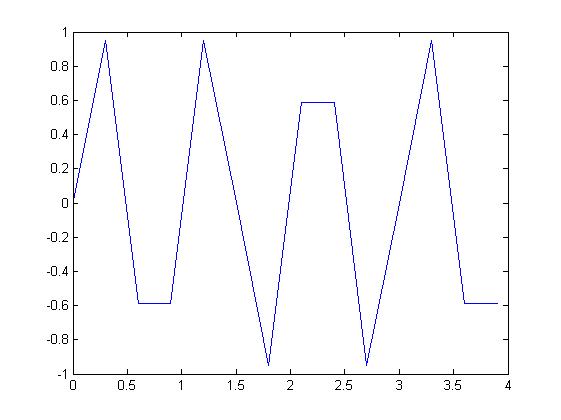
Sampling every t = 0.1, discrete dots | Sampling every t = 0.1, discrete dots | ||
| − | [[Image: | + | [[Image:hw2-2_ECE301Fall2008mboutin.jpg]] |
Revision as of 14:50, 12 September 2008
A-1 Creating two DT signals (one periodic and one non-periodic) from a periodic CT signal
I choose $ x(t) = sin (2\pi t), $ which is a periodic CT signal
original plot:


