(New page: ==Part 1: DT Signals From one CT Signal== In this example, I will use the CT signal I demonstrated in homework 1.4, <math>sin(x)</math>, to create two DT signals. One signal will be peri...) |
(→Part 2: Periodic Signal from a Non-Periodic Signal) |
||
| Line 28: | Line 28: | ||
==Part 2: Periodic Signal from a Non-Periodic Signal== | ==Part 2: Periodic Signal from a Non-Periodic Signal== | ||
| + | |||
| + | As seen in Part 1, depending on the interval, even a periodic CT signal can be rendered non-periodic, depending on the situation. Now, we will take a non-periodic signal and make it periodic. | ||
| + | |||
| + | To do this, all you have to do is take the sum of an infinite number of copies of the non-periodic signal. In equation form, | ||
| + | |||
| + | <math>\sum{x(t+kT)}</math> for CT (eq 1) | ||
| + | |||
| + | or | ||
| + | |||
| + | <math>\sum{x(n+kN)}</math> for DT (eq 2) | ||
| + | |||
| + | As an example, we will use my example of a non-periodic signal from homework 1.4, <math>log(x)</math>. | ||
| + | |||
| + | <math>log(x)</math> looks like this: | ||
| + | |||
| + | [[Image:skray_hw2_logx_ECE301Fall2008mboutin.jpg]] | ||
| + | |||
| + | ...clearly non-periodic because it grows to infinity. However, using an arbitrary k of 10 in eq 1 from above, we end up with this graph: | ||
| + | |||
| + | [[Image:skray_hw2_logx_periodic_ECE301Fall2008mboutin.jpg]] | ||
| + | |||
| + | You can now clearly see the periodicity of this function, <math>\sum{x(t+10T)}</math>. | ||
Latest revision as of 07:01, 12 September 2008
Part 1: DT Signals From one CT Signal
In this example, I will use the CT signal I demonstrated in homework 1.4, $ sin(x) $, to create two DT signals. One signal will be periodic, and the other will not.
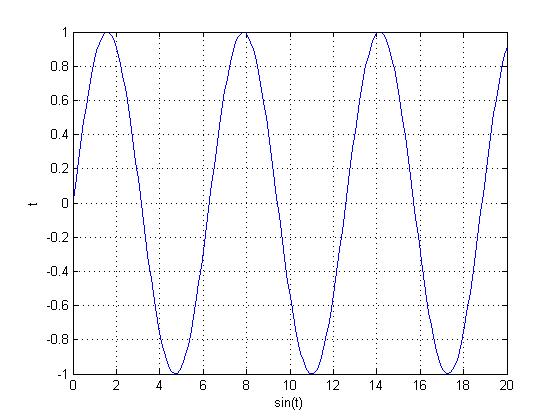
Here is the original function, $ sin(x) $
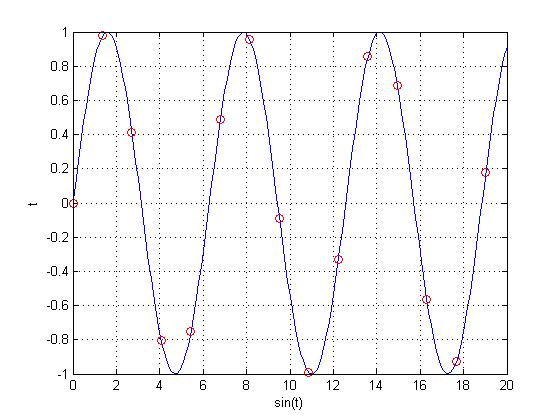
There is very little chance of accidentally getting a periodic DT signal from $ sin(x) $. Choosing some arbitrary number, we will sample $ sin(x) $ at $ \frac{e}{2} $, giving us $ x[n]=sin(\frac{e}{2}n) $. The graph of this function looks like this:
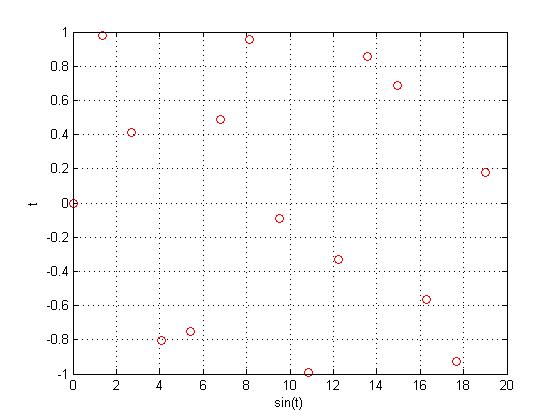
Taking out the original function $ sin(x) $, we can see that there is no pattern to the function with a sample rate of $ \frac{e}{2} $, meaning the function is not periodic.
Now, let's replace that $ \frac{e}{2} $ with $ \frac{\pi}{2} $ and see if we can come up with a periodic function.
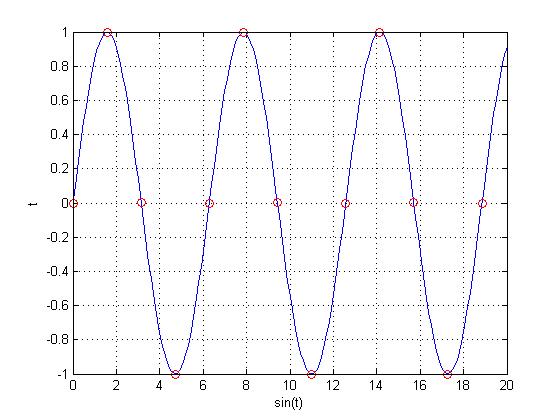
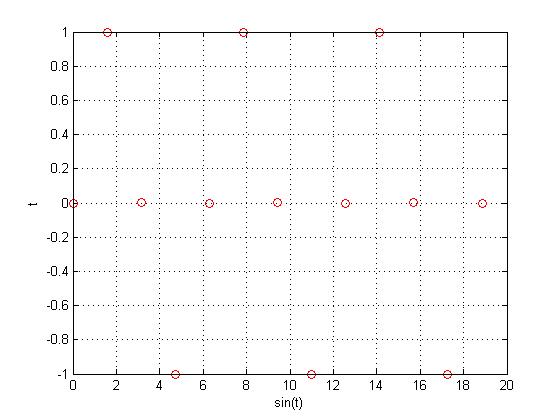
Above is the function $ x[n]=sin(\frac{\pi}{2}n) $, and if you can't see the pattern, below is the function without the underlying CT function $ sin(x) $.
As you can see from the above graph, there is a clear pattern in the function $ x[n]=sin(\frac{\pi}{2}n) $, meaning that it is periodic.
Part 2: Periodic Signal from a Non-Periodic Signal
As seen in Part 1, depending on the interval, even a periodic CT signal can be rendered non-periodic, depending on the situation. Now, we will take a non-periodic signal and make it periodic.
To do this, all you have to do is take the sum of an infinite number of copies of the non-periodic signal. In equation form,
$ \sum{x(t+kT)} $ for CT (eq 1)
or
$ \sum{x(n+kN)} $ for DT (eq 2)
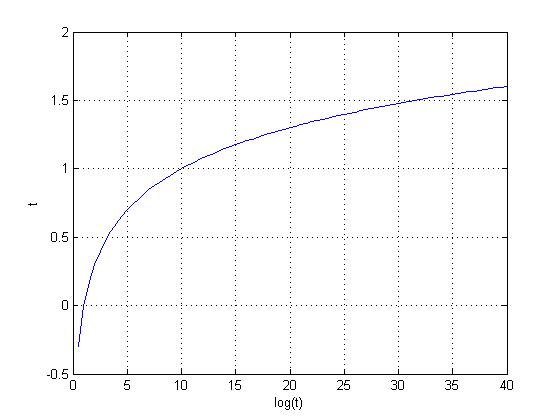
As an example, we will use my example of a non-periodic signal from homework 1.4, $ log(x) $.
$ log(x) $ looks like this:
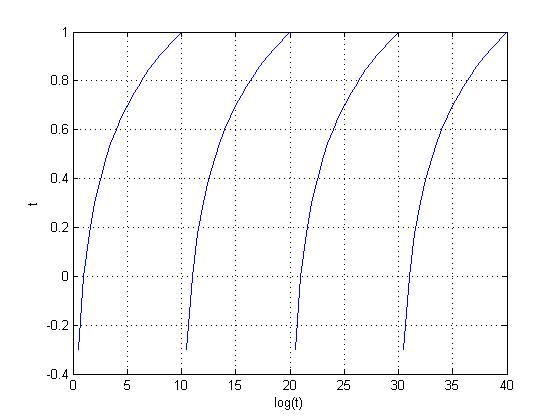
...clearly non-periodic because it grows to infinity. However, using an arbitrary k of 10 in eq 1 from above, we end up with this graph:
You can now clearly see the periodicity of this function, $ \sum{x(t+10T)} $.

