(→Periodic Signals Revisited) |
(→Periodic Signals Revisited) |
||
| Line 11: | Line 11: | ||
<math>y[n]=sin[n] \!</math> with a sample rate of <math>pi/4 \!</math> | <math>y[n]=sin[n] \!</math> with a sample rate of <math>pi/4 \!</math> | ||
[[Image:Samprate2_ECE301Fall2008mboutin.jpg]] | [[Image:Samprate2_ECE301Fall2008mboutin.jpg]] | ||
| + | |||
| + | <br> | ||
| + | The second graph has no integer value of N where y[n]=y[n+N], thus it is non-periodic. | ||
| + | The third graph clearly shows there is an integer value of N where y[n]=y[n+N], thus it is periodic. | ||
Revision as of 18:10, 11 September 2008
Periodic Signals Revisited
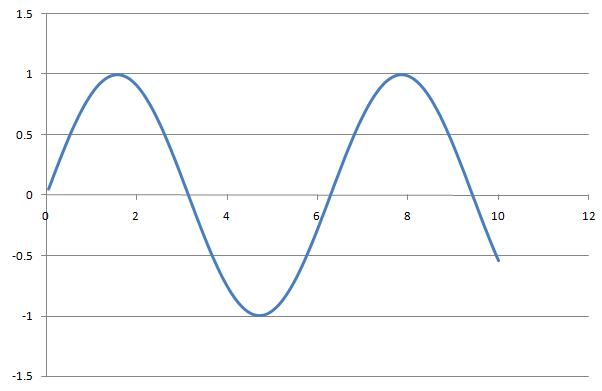
1. By sampling at different frequencies the function $ y=sin(x)\! $ can appear as both periodic and non-periodic in DT. For example:
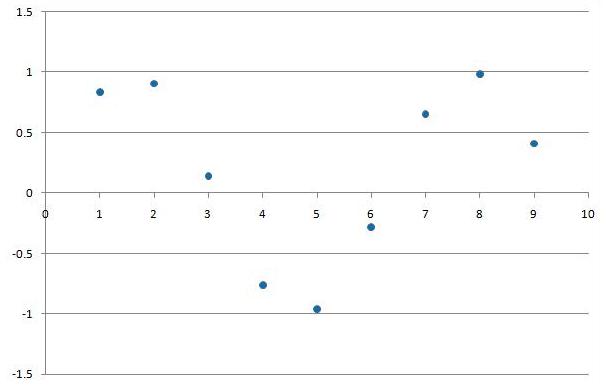
$ y[n]=sin[n] \! $ with a sample rate of 1

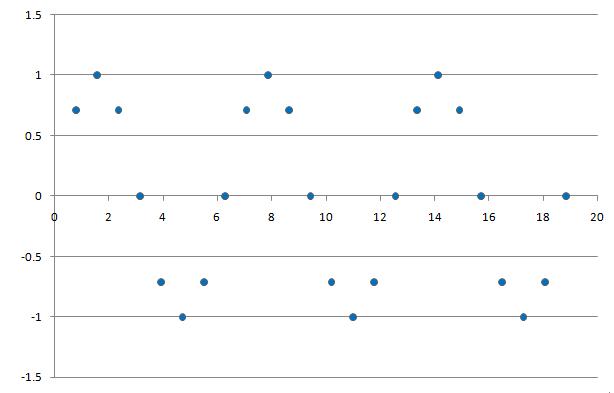
$ y[n]=sin[n] \! $ with a sample rate of $ pi/4 \! $

The second graph has no integer value of N where y[n]=y[n+N], thus it is non-periodic.
The third graph clearly shows there is an integer value of N where y[n]=y[n+N], thus it is periodic.


