m (User:Cnphilli moved to HW2-A Collin Phillips) |
|||
| (6 intermediate revisions by the same user not shown) | |||
| Line 1: | Line 1: | ||
== Homework 2 Part A-1== | == Homework 2 Part A-1== | ||
| − | < | + | <br> |
I chose the signal: | I chose the signal: | ||
| − | < | + | <br> |
<math>y = cos(n)\,</math> | <math>y = cos(n)\,</math> | ||
| − | < | + | <br> |
| − | When I took a sample at 1 hz, the signal was | + | When I took a sample at 1 hz, the signal was ugly and random. |
| + | <br> | ||
Therefore it is not periodic. | Therefore it is not periodic. | ||
| − | + | ||
[[Image:Non-periodic.jpg_ECE301Fall2008mboutin]] | [[Image:Non-periodic.jpg_ECE301Fall2008mboutin]] | ||
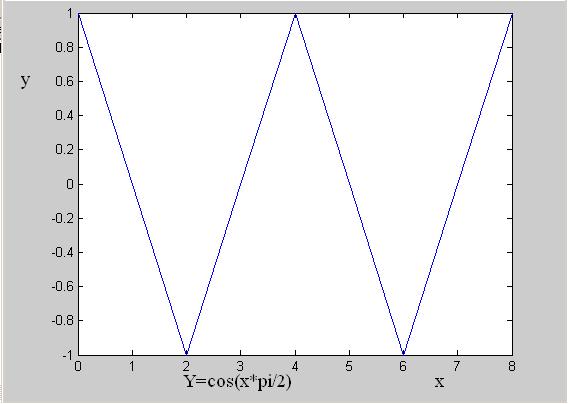
| − | Changing the function to:<math>y = cos(n*pi/2)\,</math><br> | + | <br>Changing the function to:<math>y = cos(n*pi/2)\,</math><br> |
made the signal look periodic. | made the signal look periodic. | ||
| + | <br> | ||
| + | [[Image:Periodiccnphilli_ECE301Fall2008mboutin.JPG]] | ||
| + | <br> | ||
| + | |||
| + | == Part A-2 == | ||
| + | <br> | ||
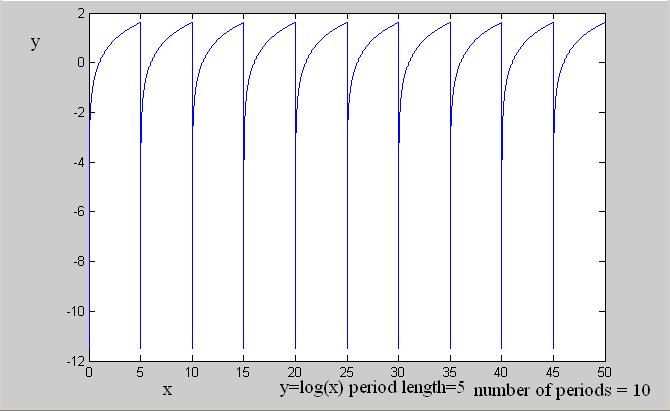
| + | I chose the signal y=log(x) | ||
| + | <br> | ||
| + | This code is not periodic, but taking a piece of it and<br> | ||
| + | Repeating it will make it periodic<br> | ||
| + | [[Image:LogA-2_ECE301Fall2008mboutin.JPG]] | ||
| + | <pre> | ||
| + | Here is the code I used: | ||
| + | |||
| + | dt = .00001; | ||
| + | periodlength = 5; | ||
| + | periods = 10; | ||
| + | |||
| + | t = [dt:dt:periodlength]; | ||
| + | y = log(t); | ||
| + | x = []; | ||
| + | for i=1:periods | ||
| + | x = [x,y]; | ||
| + | end | ||
| + | t = [dt:dt:periodlength*periods]; | ||
| + | plot(t,x) | ||
| + | </pre> | ||
Latest revision as of 13:54, 11 September 2008
Homework 2 Part A-1
I chose the signal:
$ y = cos(n)\, $
When I took a sample at 1 hz, the signal was ugly and random.
Therefore it is not periodic.
File:Non-periodic.jpg ECE301Fall2008mboutin
Changing the function to:$ y = cos(n*pi/2)\, $
made the signal look periodic.

Part A-2
I chose the signal y=log(x)
This code is not periodic, but taking a piece of it and
Repeating it will make it periodic

Here is the code I used:

dt = .00001;
periodlength = 5;
periods = 10;

t = [dt:dt:periodlength];
y = log(t);
x = [];
for i=1:periods
   x = [x,y];
end
t = [dt:dt:periodlength*periods];
plot(t,x)

